Market Snapshot
Primary asset: LINK. Latest intra-day context places LINK within a defined range anchored by near-term support and resistance. The current bias is modestly bearish with a 51% probability of downward movement over the next 24 hours, and a 42% probability of upward movement. The implied forecast remains sideways to down, with technical indicators illustrating a cautious posture as price tests key levels.
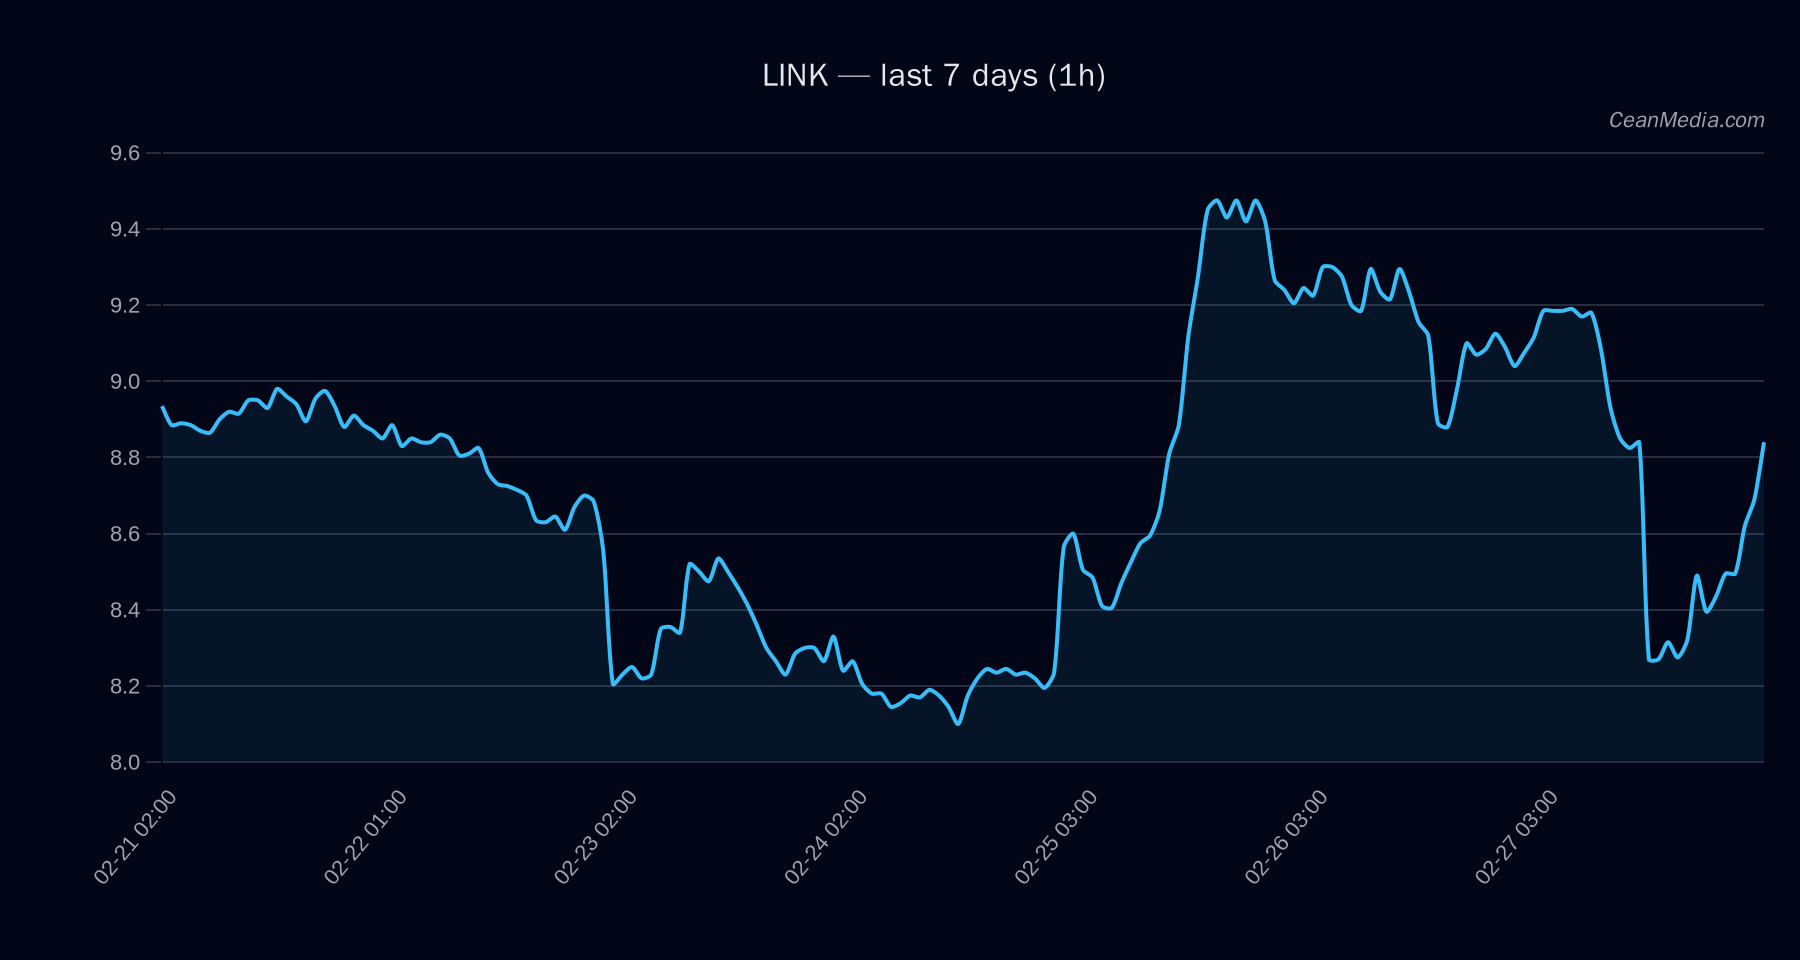
Technical Analysis: LINK
8.8 with Top/Bottom range roughly 8.28–9.12 in major terms. Band (P20–P80) spans 8.422 to 9.1474. Down 51% with a sideways technical regime. RSI at 55, suggesting neutral momentum. EMA cross configuration indicates EMA12 < EMA26 and SMA50 > SMA200, consistent with a cautious or consolidative phase. - Support (Major): 8.28
- Support (Near): 8.62
- Resistance (Near): 8.98
- Resistance (Major): 9.12
σ24h = 1.56% with a low volatility regime currently observed. Breadth indicators show limited breadth (Breadth>50h: 0%). BTC dominance around 56.3% with a slight 7-day decline. Fear/volatility sentiment (F&G) reading at 11 indicates Extreme Fear on the broader market backdrop.
Drivers
- EMA slope: 0.005 (positive, but marginal in directional implication).
- Funding Z-Score: -1.74 (negative pressure signal, indicating funding conditions less favorable for long positioning in the near term).
- Basis Z-Score: 0.96 (neutral-to-positive basis spread relative to benchmark).
- Order-book Imbalance (EMA5): 0.04 (moderate tilt toward bid-side execution, but not decisive).
- 14/72h momentum proxies and depth metrics show mixed signals; overall momentum remains subdued with a tilt toward downside risk given the forecast.
ETF Flows (BTC/ETH)
The ETF flow data presented relates exclusively to BTC and ETH as context for macro-risk sentiment and liquidity conditions. This information is not a primary signal for LINK’s price action but provides market context:
- BTC ETF 1D: -$27.5M
- BTC ETF 5D: +$395.5M
- BTC ETF 10D: +$298.6M
- ETH ETF 1D: -$41.7M
- ETH ETF 5D: +$82.2M
- ETH ETF 10D: -$9.2M
Interpretation: The net 1D flow for BTC is negative while longer horizons show mixed inflows, and ETH shows smaller scale net negative in the near term with modest longer-term inflows. This pattern can reflect risk-on/off dynamics influencing broad market risk appetite. Readers should treat ETF data as contextual rather than a sole driver for LINK movements.
What to Watch Next
- Monitor for a close above 8.98 to validate near-term upside potential toward 9.1555–9.335.
- Watch for a break below 8.62 to suggest renewed downside toward 8.4515–8.279.
- Observe changes in EMA cross dynamics (EMA12/EMA26) and volatility regime shifts, which could alter the bias.
- Keep an eye on overarching market risk sentiment signals (F&G, BTC.D, and breadth) for potential correlation with LINK’s price action.
Hashtags: #LinkAnalysis #CryptoTechnicals #LINKForecast #ETFFlows #BTCFlows #MarketSnapshot #TradingStrategy #CryptoAnalysis #AltcoinTrading #PriceLevels #RiskManagement