Market Snapshot
As of 2026-03-08, XRP price is approximately 1.3541. The short-term forecast indicates a bearish tilt (55% probability of downside) with a neutral to cautious bias observed in momentum indicators. Volatility regime is described as Very Low, suggesting a subdued trading environment. Key nearby support is around 1.32 to 1.34, with resistance near 1.38 to 1.44. A break above 1.38 would target 1.4088–1.4364, while a break below 1.32 would open 1.3005–1.2739.
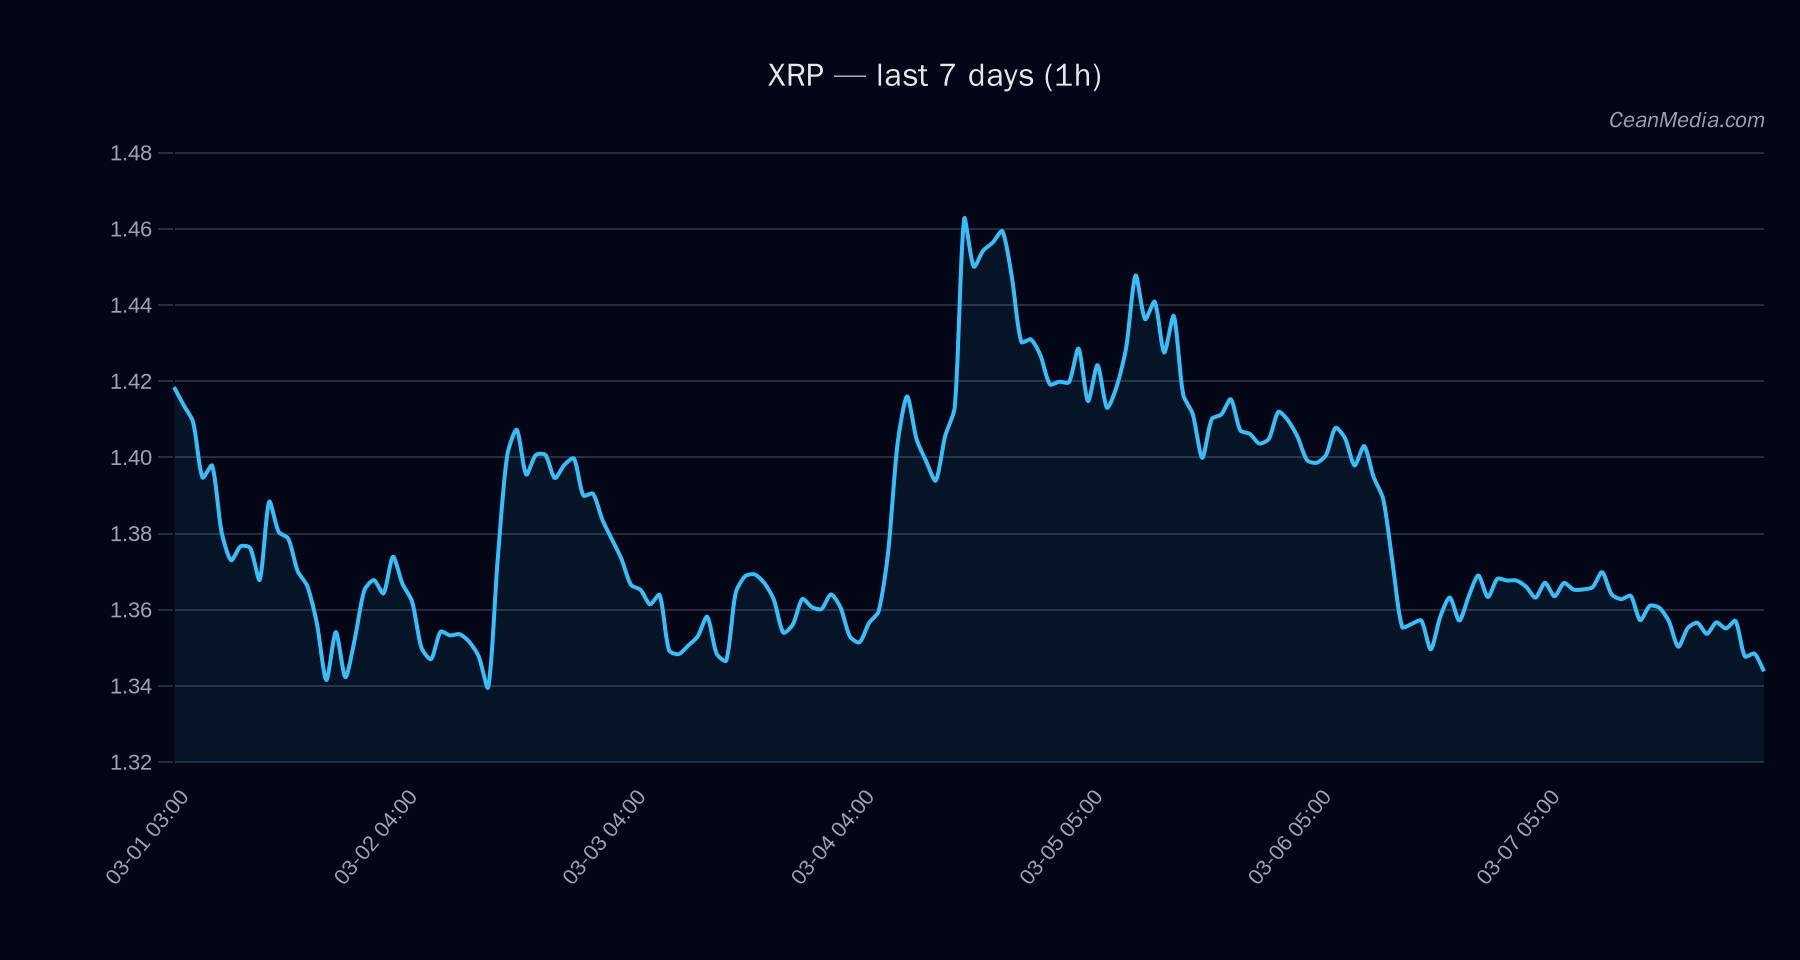
Technical Analysis: XRP
- Near support: 1.32–1.34 (major 1.34)
- Near resistance: 1.38
- Major resistance: 1.44
- Projected upside if breakout occurs: 1.4088–1.4364
- Projected downside if breakdown occurs: 1.3005–1.2739
EMA12 < EMA26, SMA50 < SMA200, RSI at 44 (neutral). Volatility regime: Very low. RSI is neutral, suggesting limited momentum at current levels. Distance from major moving averages and rate of change indicate limited upside pressure in the near term.
Drivers
-0.01 - EMA slope: -0.0013
- Funding Z-score: -1.15
- Basis Z-score: -0.33
- Order-book imbalance (EMA5): -0.03
- BTC Return 24h: -0.02
- BTC Vol regime: -1 (low volatility)
- BTC Trend strength: 1.47
Additional context from the forecast JSON indicates a 24-hour horizon with a range from 1.3029 to 1.4172, probability of Up ~39%, Sideways ~6%, Down ~55%.
ETF Flows (BTC/ETH)
Contextual market signal: ETF flows for BTC and ETH show net outflows on the 1-day horizon: BTC ETF -$348.9M; ETH ETF -$91.5M. Over 5 and 10 days, BTC shows mixed flow with a sizable 5-day outflow (-$235.0M) and a 10-day inflow (+$160.5M); ETH shows ongoing small outflows. It is important to note that ETF data here is BTC/ETH-only and is provided as contextual market activity, not as a primary signal for XRP.
What to Watch Next
- Watch for a break above 1.38 to validate a bullish retrace toward 1.4088–1.4364.
- Monitor for a break below 1.32 to confirm a bearish extension toward 1.3005–1.2739.
- Consider the broader risk environment signaled by BTC/ETH ETF flows, while treating XRP moves as primarily driven by its own technicals and micro-structure indicators.
- Keep an eye on volatility regime transitions, as a shift from Very Low may increase the reliability of short-term breakout signals.
Hashtags: #XRP #CryptoAnalysis #MarketSnapshot #TechnicalAnalysis #BTCETFFlows #ETHETFFlows #PriceAction #SupportAndResistance #Momentum #Volatility #TradingStrategy