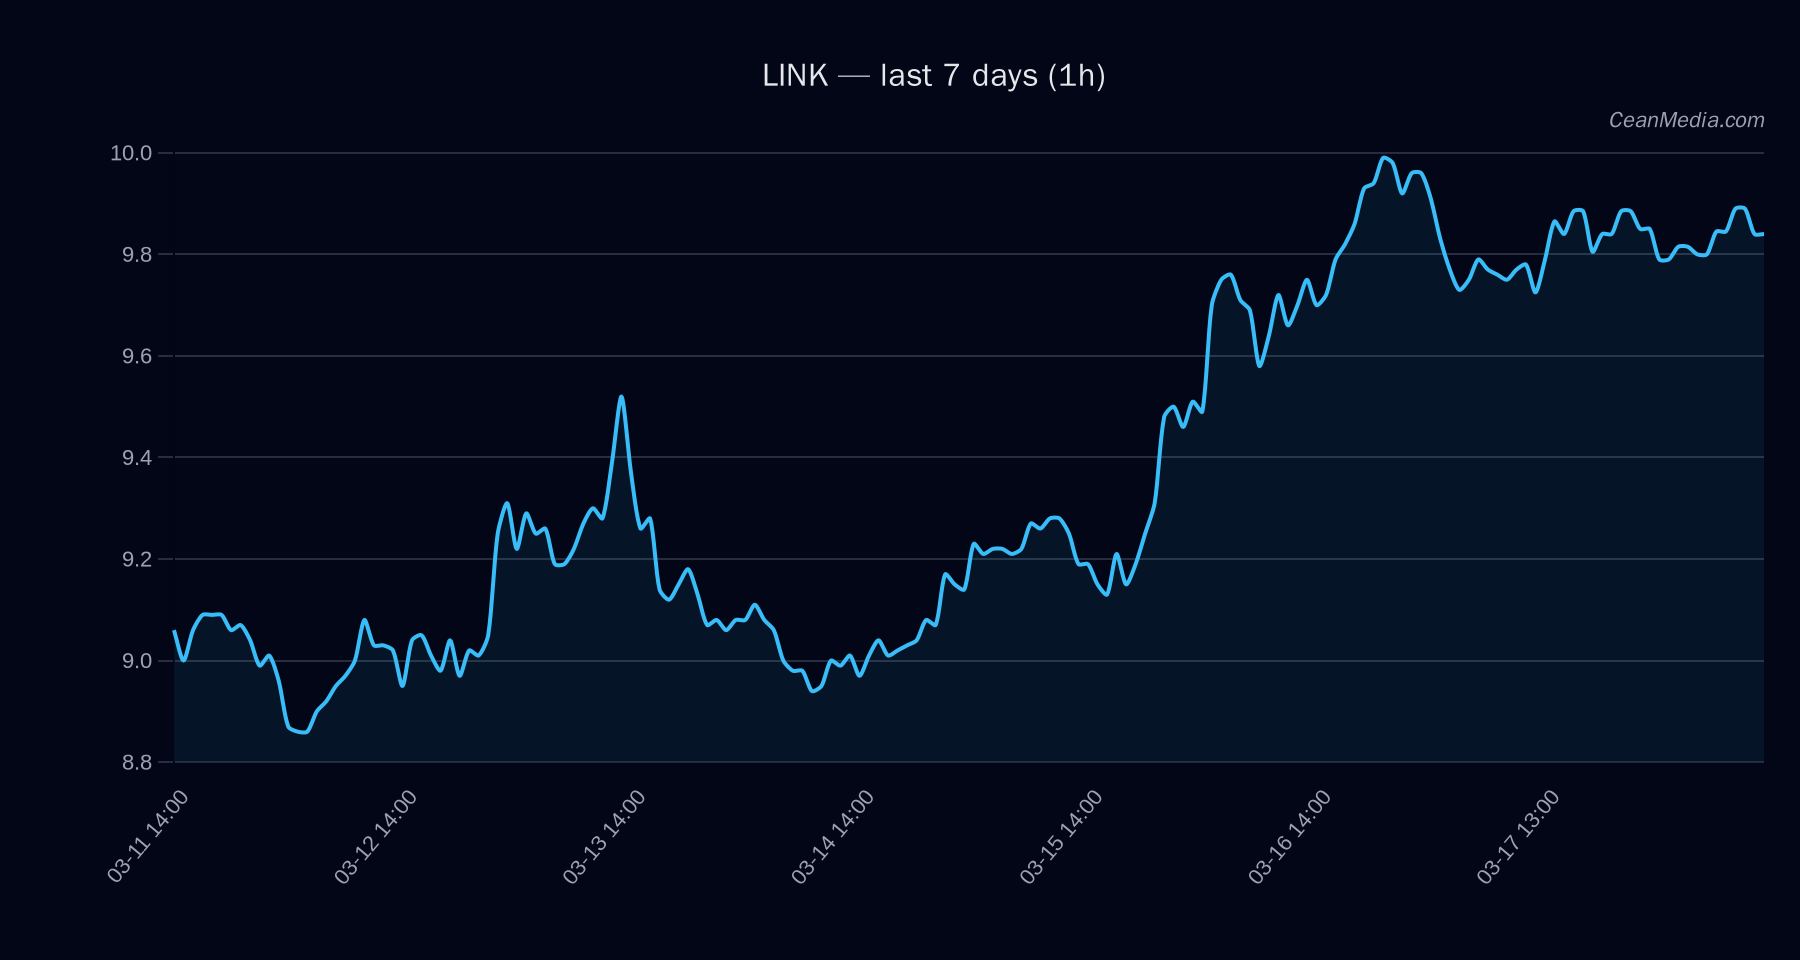
Market Snapshot
Price for LINK: 9.83. Short-Term Forecast: down (47%). The market shows a neutral to slightly bearish bias in the near term, with support near 9.64 and resistance around 9.72. The chart regime indicates very low volatility (σ24h 0.41%), and RSI is at 52, suggesting a balanced momentum canvas rather than strong directional momentum.
Technical Analysis: LINK
Support (Major) 8.88; Support (Near) 9.64; Resistance (Near) 9.72; Resistance (Major) 10.00. Break above 10.00 targets 10.23–10.43 (upside). Break below 9.64 targets 9.44–9.25 (downside). EMA12 > EMA26; SMA50 > SMA200, which provides a bullish structural backdrop despite near-term downside forecast. Very low volatility regime supports subdued price action around current levels. RSI at 52 indicates neutral momentum; price may drift with minor fluctuations within the defined band (P20–P80: 9.6315 – 9.9792).
Drivers
- Top drivers (selected):
- Return 24H: +0.72%
- EMA Slope: +0.00006
- Order-Book Imbalance (EMA5): 0.06
- BTC Return 24H: -0.10%
- BTC Trend Strength: 0.05
- Vol Regime: Very low
- Distance from MA: +0.0189
- Overall interpretation: The combination of a modest positive 24H price move with a bullish MA configuration counters the near-term downside forecast, keeping a neutral-to-bearish tilt intact given the limited volatility environment.
ETF Flows (BTC/ETH)
Contextual note: ETF flow data provided here is limited to BTC and ETH and is not a primary signal for LINK. It offers macro-market context to risk appetite and liquidity conditions.
- BTC ETF: 1D +$30.1M | 5D +$664.5M | 10D +$292.3M
- ETH ETF: 1D -$8.3M | 5D +$134.2M | 10D +$18.2M
What to Watch Next
- Monitor intraday price action as LINK approaches 9.64 support for potential test of downside band 9.44–9.25.
- Watch for a break above 10.00 to confirm upside target band toward 10.23–10.43.
- Continue to track EMA12/EMA26 and SMA50/SMA200 alignment for incremental bullish confirmation despite the near-term forecast.
- Consider macro-risk signals or BTC/ETH flow shifts as broader context, noting ETF data is not a primary driver for LINK.
Hashtags: #LinkAnalysis #CryptoMarket #TechnicalAnalysis #BTCFlows #ETHFlows #MarketSnapshot #AltcoinWatch #PriceAction #TradingView #BTCETF #ETHETF #RiskContext