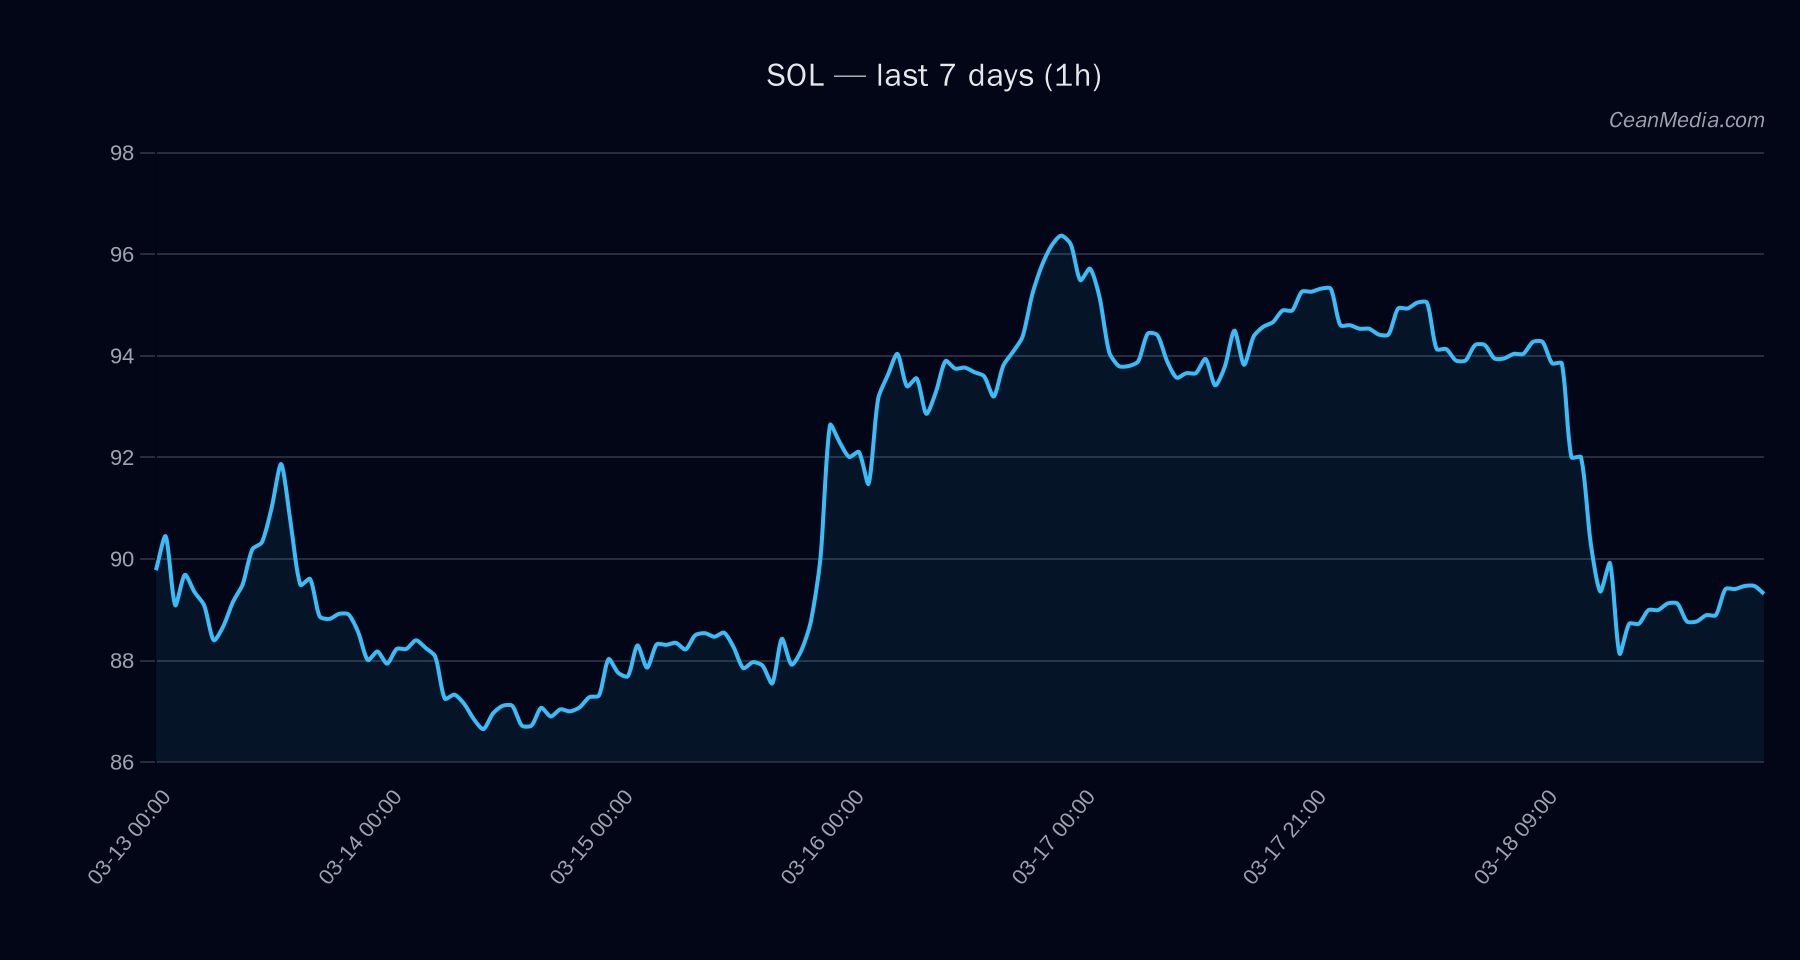
Market Snapshot
SOL sits within a defined range near the 87.6 support and 91.1 resistance levels, with a near-term bias tilted to the upside on a break above 91.1. Current price around 89.36. Market context shows very low volatility regime and a neutral to slightly cautious technical stance.
Technical Analysis: SOL
- Current Price: 89.36
- Short-Term Forecast: Up (51%)
- Key Levels:
- Support (Major): 83.6
- Support (Near): 87.6
- Resistance (Near): 91.1
- Resistance (Major): 93.8
- Targets (if Break Above 91.1): 92.9701 – 94.7931
- Targets (if Break Below 87.6): 85.8213 – 84.0699
- Indicators Context:
- RSI: 35 (oversold/rangebound)
- EMA12 < EMA26; SMA50 > SMA200
- Volatility: σ24h ~ 0.77%, Vol regime: Very low
- Bias: Up (51%), but current TA describes sideways dynamics with limited directional momentum.
- Invalidation/Trends: A sustained close above 91.1 strengthens the upside targeting 92.97–94.79. A sustained close below 87.6 weakens the near-term setup toward the 84.07–85.82 zone.
Drivers
- Top drivers include EMA slope (-0.001), order-book imbalance (EMA5: 0.05), and a neutralizing volatility regime (Very low).
- 24h return data is not available in the current context; other metrics indicate modest downside pressure on momentum and a cautious stance on near-term direction.
- Breadth metrics report limited participation (Breadth>50h: 0%), and broad market signals hint at cautious risk appetite.
ETF Flows (BTC/ETH)
Context: ETF flow data provided here is limited to BTC and ETH and is presented as a macro-market backdrop rather than a SOL-specific signal. BTC ETF flows show a 1D negative, but 5D and 10D positive momentum, while ETH ETF shows mixed directions across the same windows. These flows imply a nuanced risk-on/off backdrop for correlated assets but should not be used as a primary signal for SOL price action.
- BTC ETF: 1D -$163.5M | 5D +$423.4M | 10D +$395.3M
- ETH ETF: 1D -$51.3M | 5D +$219.2M | 10D +$167.8M
What to Watch Next
- Watch for a close above 91.1 to validate the upside extension toward 92.97–94.79.
- Monitor for a break below 87.6 to confirm potential move toward 84.07–85.82.
- Maintain awareness of the very low volatility regime which may compress or extend short-term moves.
- Consider how BTC/ETH ETF flows could set broader risk sentiment that can impact correlated assets, while recognizing they are context rather than primary SOL signals.
Hashtags: #Solana #SOL #MarketUpdate #TechnicalAnalysis #ETFFlows #CryptoNews #CryptoMarkets #TradingStrategy #PriceAction #Momentum #Liquidity #Bitcoin