Market Snapshot
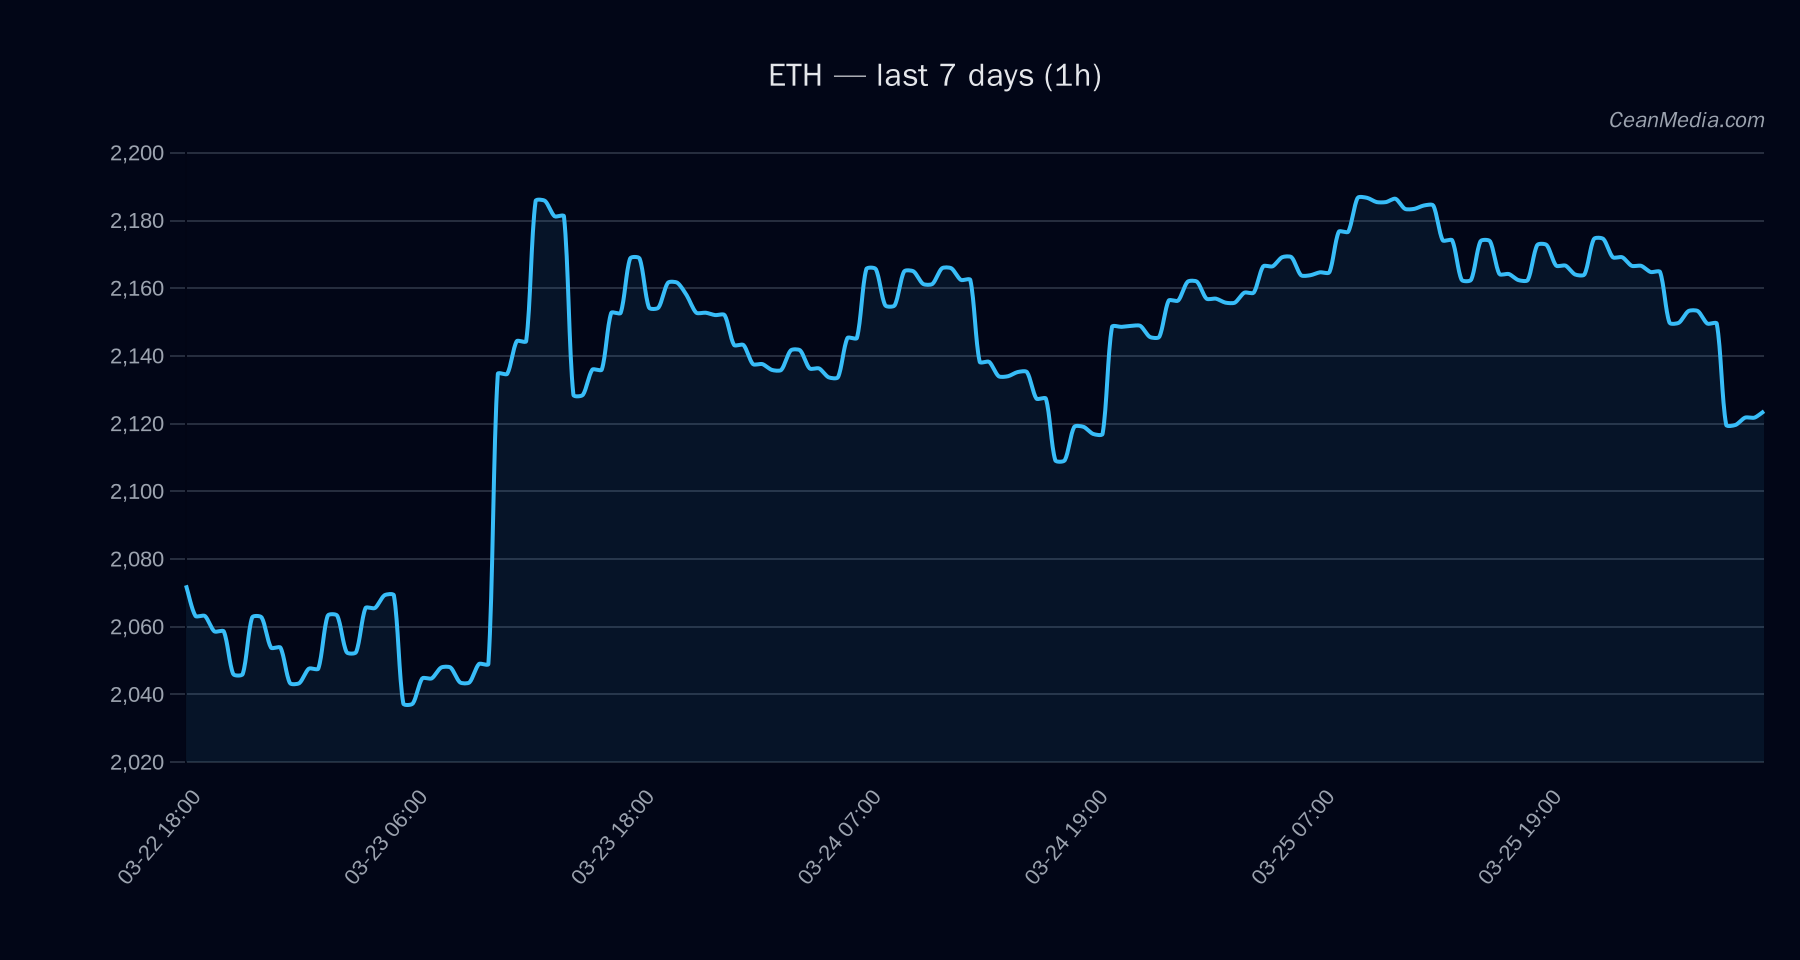
Price (ETH): 2,123.38. The asset is trading within a tight range, with near-term support at 2,080 and resistance at 2,166. The current setup shows a bearish TA lens on classic moving average relationships and momentum indicators, but a slight bullish tilt is suggested by the 1H breakout scenarios outlined below.
Technical Analysis: ETH
- Key levels:
- Support: 2,080 (near), 2,024 (major)
- Resistance: 2,166 (near), 2,228 (major)
- Bias and triggers: Forecast: up with 53% probability for the next 24 hours. Break above 2,166 targets 2,209.16–2,252.48. Break below 2,080 targets 2,039.29–1,997.68.
- Momentum indicators: RSI 34 (neutral/lower end), EMA12 < EMA26, SMA50 < SMA200 (bearish cross context historically)
- Volatility and regime: Very low volatility regime; σ24h = 0.43%.
- Forecast detail: P50 around 2,132.31, Band (P20–P80) 1,914.57–2,242.58. Upside path conditional on a close above 2,166 in the near term.
Drivers
- Top drivers (magnitude-focused):
- Return 24H: -0.02
- EMA Slope: -0.0019
- Funding Z-Score: -0.37
- Basis Z-Score: -0.43
- Order-book Imbalance (EMA5): -0.05
- BTC Return 24H: -0.01
- Contextual momentum: BTC trend strength ~0.61; volatility regime is very low; F&G (Fear/Greed) at 10 (Extreme Fear) suggests cautious market sentiment overall. If BTC improves, ETH could benefit from broader risk-on conditions, but current signals are mixed given subdued breadth and ETF commentary.
ETF Flows (BTC/ETH)
Context: ETF flow data is provided for BTC and ETH as a supplementary backdrop and is not a primary signal for ETH-specific trading decisions. BTC ETF flows show a 1D positive inflow of +$78.5M, with multi-day trends drifting negative on longer horizons. ETH ETF flows show a +$23.8M 1D inflow but negative 5D flows. These figures reflect investor positioning and can influence correlated market dynamics, though they should not be treated as ETH-only signals.
- BTC ETF: +$78.5M (1D), -$80.9M (5D), +$342.5M (10D)
- ETH ETF: +$23.8M (1D), -$43.2M (5D), +$176.0M (10D)
What to Watch Next
- Strong move above 2,166 would open a path toward 2,209–2,252 in the short term.
- Failure to hold 2,080 increases risk toward the 2,039–1,998 region.
- Monitor BTC momentum and ETF flow context as potential drivers of ETH short-term volatility, acknowledging ETF data is context, not primary ETH signal.
- Watch for any change in volatility regime from very low toward higher dispersion, which could precede a more decisive directional move.
Hashtags: #ETH #CryptoMarket #TechnicalAnalysis #ETFFlows #Bitcoin #Altcoins #CryptoNews #MarketOutlook #PriceAction #TradingStrategies #Liquidity #RiskManagement