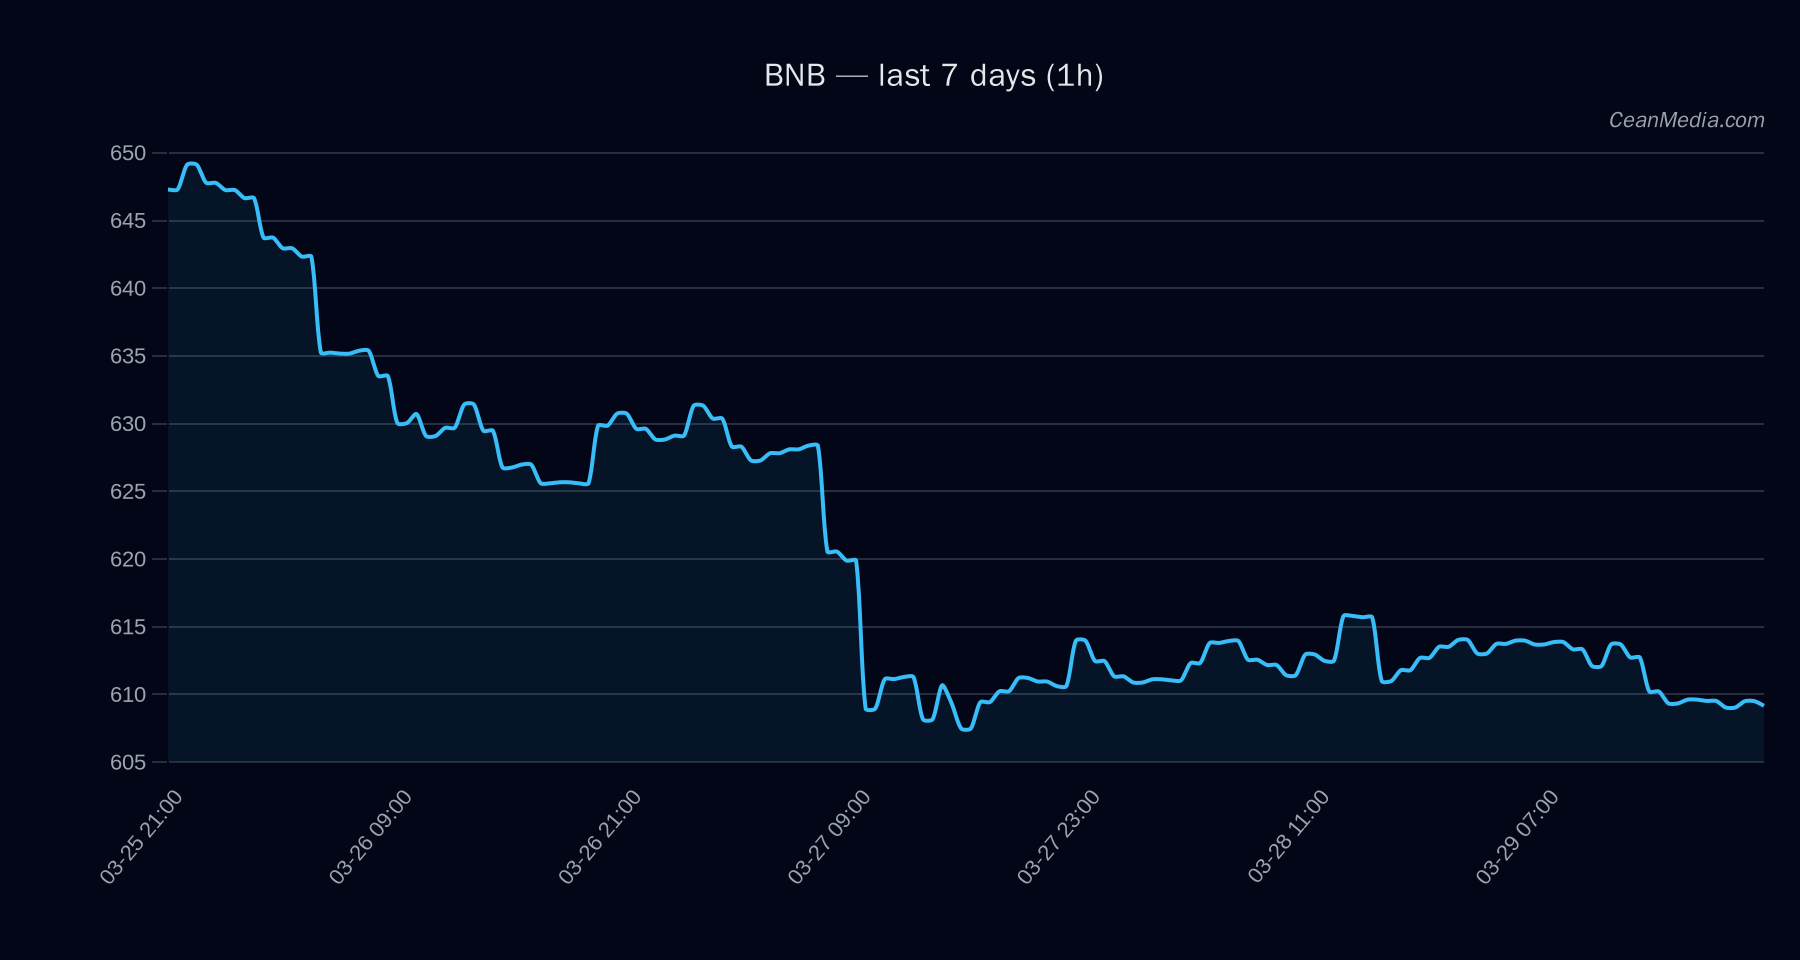
Primary asset: BNB. Current price around 610.25 with a short-term bias leaning up (probability ~50%). The immediate structure sits between key levels: support near 598 and major support around 614; resistance at 622 and major resistance at 640. The latest indicators show a bearish tilt in terms of EMA and moving averages (EMA12
Technical Analysis: BNB
Up (50%); near-term potential for a upside continuation if resistance around 622 is broken.
P20–P80 band 573.49–644.99; P50 around 609.52; current price 610.25 sits near the mid of the band.
Drivers
(qualitative):
EMA slope: -0.0004
Funding Z-score: -0.36
Basis Z-score: -0.30
Order-book imbalance (EMA5): 0.04
Volatility regime: Very low
: Breadth reading around 33% (Breadth>50h). BTC-related factors show a 72h correlation of 0.90 but BTC flow signals are- not clearly aligned with BTC price moves. BTC.D stands at 56.1% (slightly decreasing over 7 days). F&G (sentiment) reading indicates Extreme Fear (9). Overall, the macro tone is cautious with limited near-term volatility potential.
ETF Flows (BTC/ETH)
Contextual note: ETF flow data shown below is for BTC and ETH and is provided as market context rather than a primary signal for BNB. The flows indicate risk-off or risk-on sentiment shifts tied to large cap crypto exposures staged via BTC/ETH ETFs.
1D -$225.5M; 5D -$331.9M; 10D -$200.5M
1D -$47.6M; 5D -$66.2M; 10D -$2.4M
Interpretation: The BTC/ETH ETF flows suggest a net outflow over the short-to-intermediate horizon, which may imply a cautious or risk-off environment among broader crypto markets. This is contextual information and should not be interpreted as a direct signal for BNB alone, which is trading on its own technicals and fundamentals.
What to Watch Next
Watch for a close above 622 to confirm upside momentum toward 634.90–647.35.
Monitor if price holds above 598 to maintain the near-term bullish bias.
Keep an eye on volatility regime; a shift from very low could precede higher swing activity.
Consider ETH/BTC ETF flow developments as broader market context but not a primary driver for BNB decisions.