Market Snapshot
SOL is trading around the mid-80s, with short-term momentum showing a slight bearish tilt as of 2026-04-10. The immediate price range sits between major support at 80 and resistance at 87.6, with a near-term bias leaning toward downside unless breakout conditions are met. Market breadth is strong on the positive side (Breadth>50h: 100%), and BTC correlations and alt breadth indicators suggest a broad risk-on environment while overall volatility remains very low.
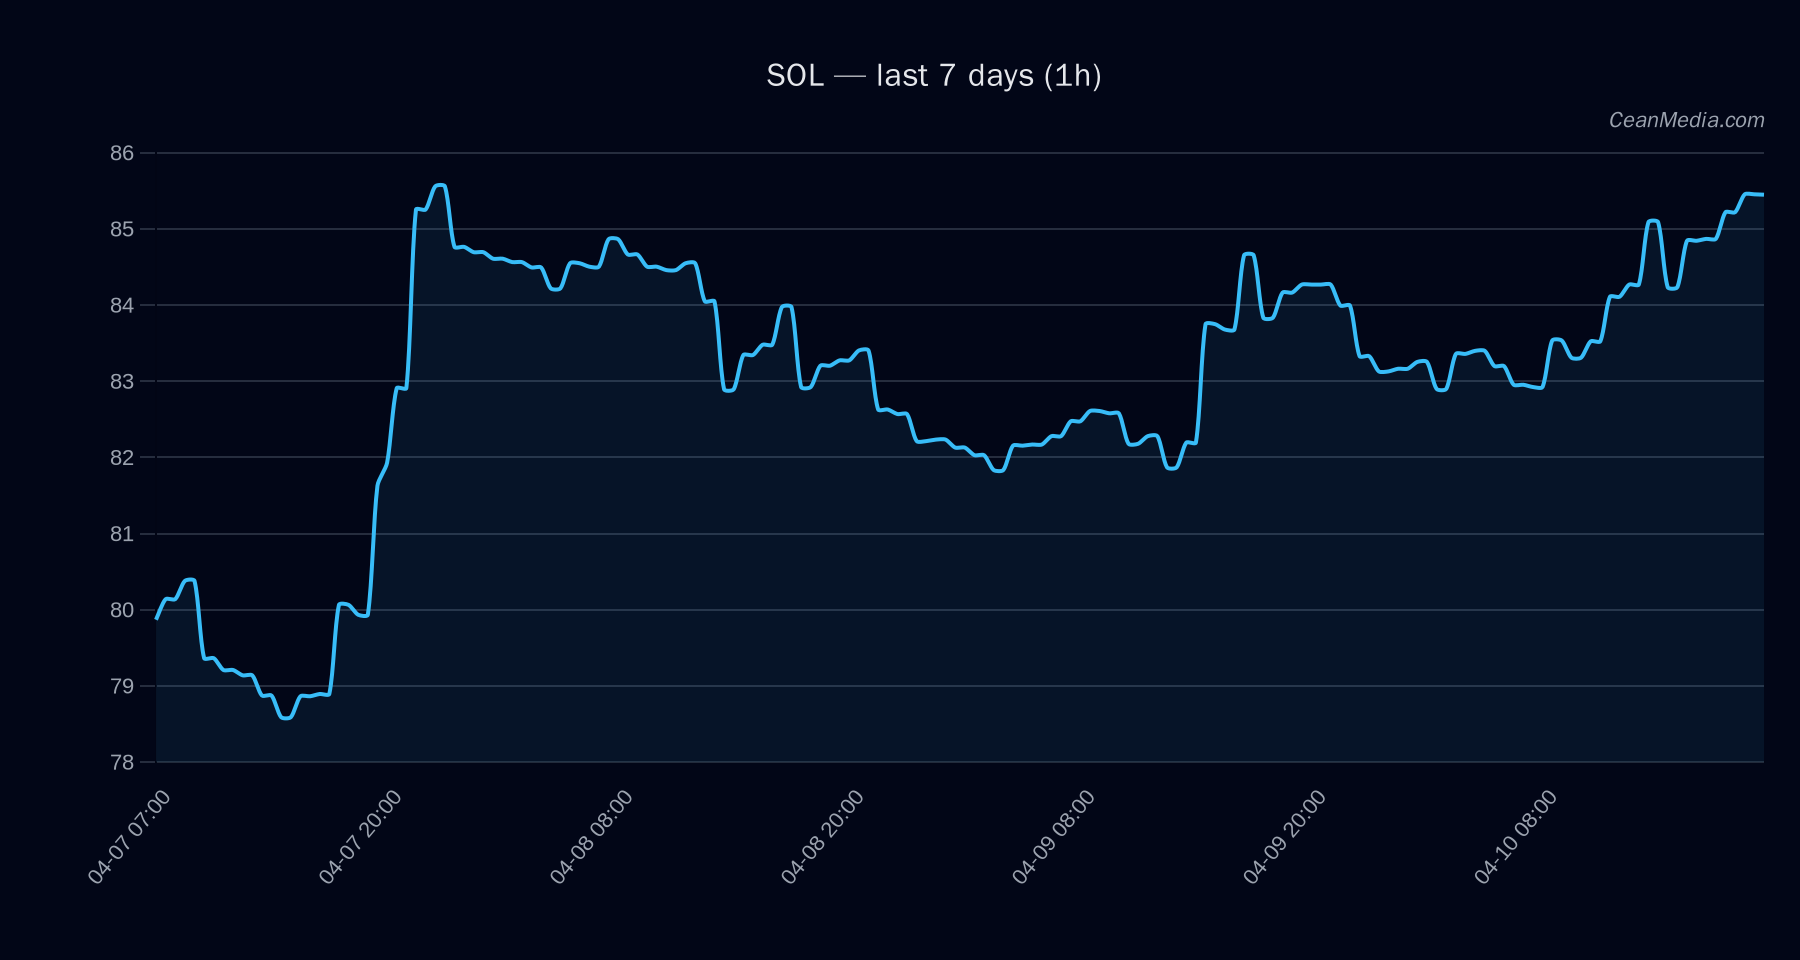
Technical Analysis: SOL
- Current price: 85.4
- Short-Term Forecast: down (48%)
- Probabilities: Up 44%, Sideways 8%, Down 48%
- Momentum Indicators: EMA12>EMA26, SMA50>SMA200, RSI 65, σ24h 0.47%
- Band/Volatility: P20–P80 band 76.504–93.4091; Vol regime: Very low
- Support / Resistance: Major support 80, Near support 83.7; Major resistance 87.6, Near resistance 87.1
- Projected Triggers: Upside if 1h close > 87.1 (target 88.85–90.59); Downside if 1h close < 83.7 (target 82.02–80.34)
Drivers
- Top model drivers: DEPTH USD 10BP LOG1P: +2.57 (15.78), SPREAD BP: -1.19 (1.17), LS GLOBAL Z-SCORE: -0.88 (-1.27), LIQ REL: -0.84 (0.55), DISTANCE FROM MA: 0.52 (1), LIQ IMB Z-SCORE: 0.48 (2.13), SPREAD Z-SCORE: 0.41 (-0.51), LS TOP Z-SCORE: 0.32 (-1.36)
- Other context: Breadth indicators are positive; BTC-70h trend strength around 0.758; overall market signals point to cautious downside on SOL in the near term within a very low volatility environment.
ETF Flows (BTC/ETH)
ETF flow data provided pertains to BTC and ETH only and serves as contextual risk sentiment rather than a primary signal for SOL. BTC ETFs: +$35.5M today, +$269.1M over 5 days, +$172.1M over 10 days; ETH ETFs: -$8.1M today, -$27.2M over 5 days, -$55.5M over 10 days. Interpretation: net modern asset flows indicate a mixed risk-on/-off backdrop for the broader crypto space, with BTC showing stronger booking of inflows versus ETH and without a direct, deterministic implication for SOL performance.
What to Watch Next
- Watch for a close above 87.1 to confirm upside trigger toward 88.85–90.59.
- Monitor a close below 83.7 to confirm near-term downside targeting 82.02–80.34.
- Look for confirmation from EMA12/EMA26 and SMA50/SMA200 alignment as a supporting factor for directional bias.
- Assess intra-day volatility; a shift from very low to higher regime could precede a clearer breakout/breakdown signal.
Hashtags: #SOL #cryptomarket #technicalanalysis #ETFlows #BTC #ETH #riskon #riskoff #blockchain