Market Snapshot
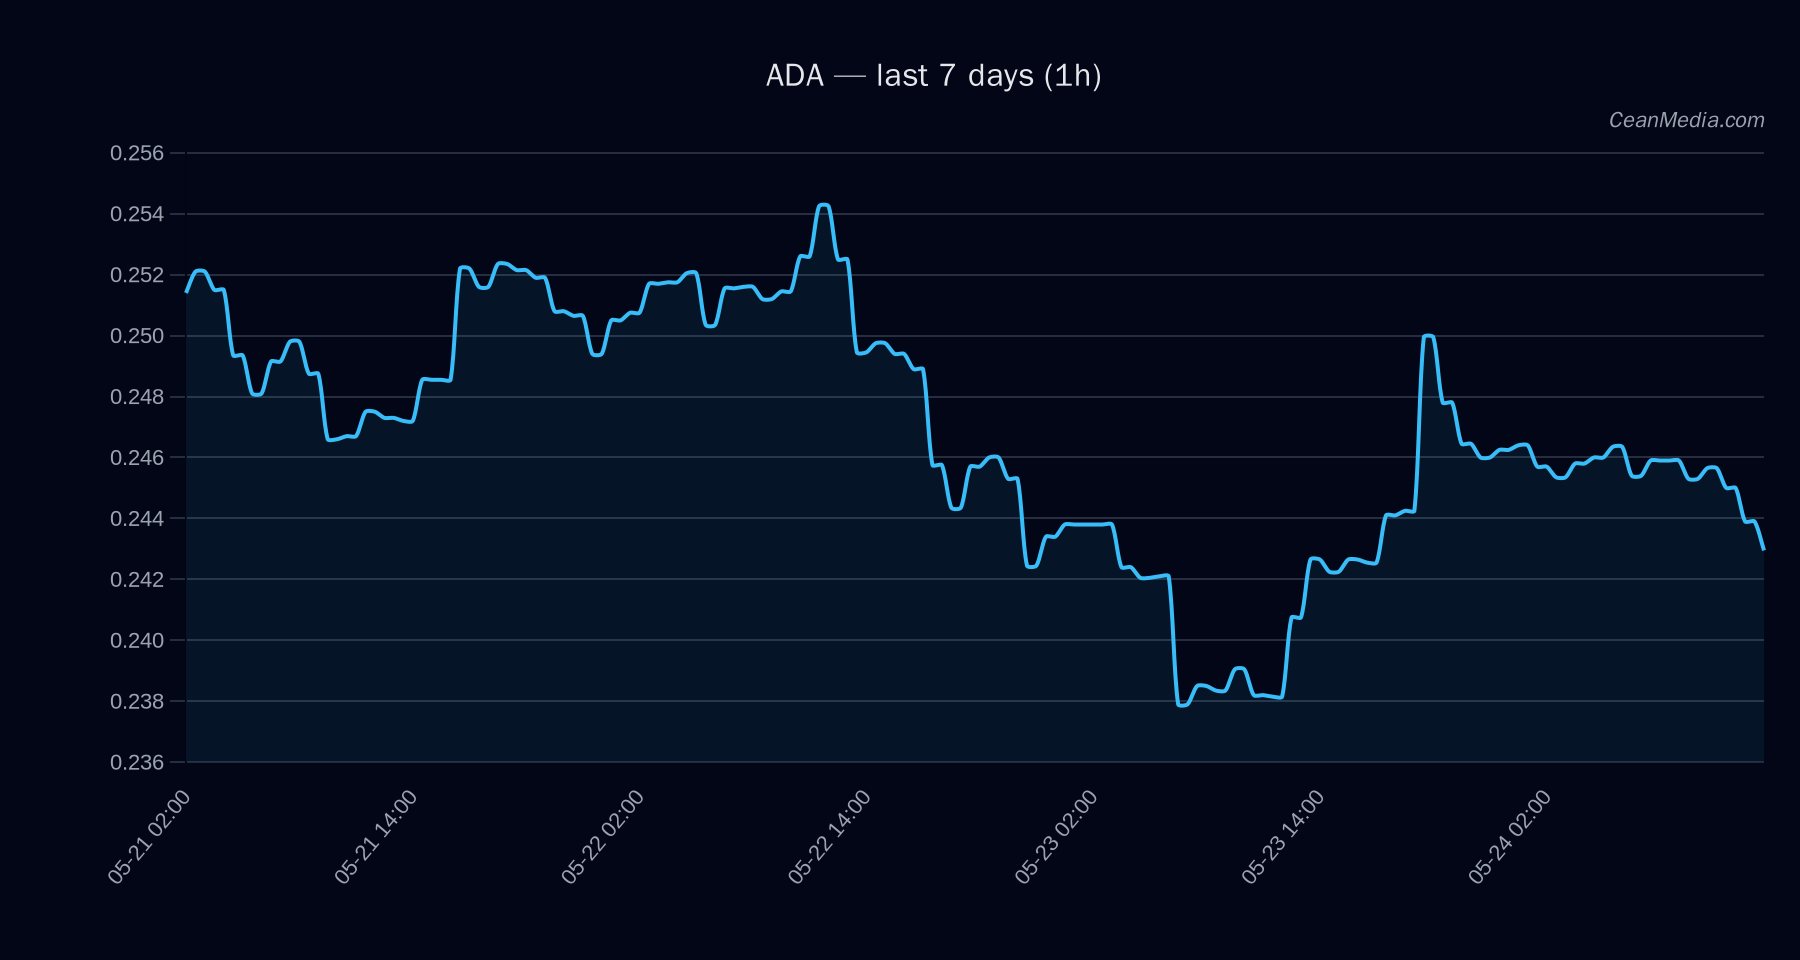
Asset: ADA. Close price 0.2429 (as of 2026-05-24 15:06 UTC). Market tone is mixed with bearish pressure, low confidence (5/100). Composite score negative (-2.4) with conflicting signals. Overall breadth remains positive (83% above SMA50) but volatility is very low, indicating subdued price action in the near term.
Technical Analysis: ADA
Up (71%), Sideways 13%, Down 17%. Bearish. Key indicators: EMA12 < EMA26, SMA50 < SMA200, RSI 40; volatility (σ24h) 0.57%; very low volume regime.
Support near 0.24; major support at 0.245. Resistance near 0.25; major resistance at 0.265.P50 0.24896, P20-P80 0.2333 – 0.2561. Trigger levels: Up break > 0.25 (target 0.2527–0.2577); Down break < 0.24 (target 0.2333–0.2285). + - Return 24h: 0.00124
- EMA slope: -0.00145
- Funding Z-score: 1.443
- Basis Z-score: -1.087
- BTC return 24h: 0.0123
Evidence alignment is mixed; wait for trigger confirmation before treating direction as high-conviction.
Drivers
- Top model drivers indicate mixed momentum signals with modest negative TA input but external supportive factors from BTC performance.
- Momentum/volatility: Vol regime is very low; RSI neutral; Trend strength modest.
- _ALT focus_: The net composite suggests caution despite a probabilistic upside bias (71%).
ETF Flows (BTC/ETH)
The ETF flow data provided are BTC/ETH-only and serve as contextual market sentiment rather than a primary ADA signal. Current readings show positive daily ETF inflows for BTC (+629.8M) and ETH (+101.2M), with multi-day totals also in positive territory. This pattern can reflect risk-on appetite and liquidity support in broad crypto markets, which may indirectly influence ADA demand and market breadth. Do not treat ETF data as a direct ADA trigger.
- BTC ETF: 1D +$629.8M | 5D +$198.4M | 10D +$585.2M
- ETH ETF: 1D +$101.2M | 5D -$20.8M | 10D +$81.6M
What to Watch Next
- Watch for a sustained close above 0.25 to validate the upside trigger toward 0.2527–0.2577.
- A break below 0.24 would open a path toward 0.2333–0.2285; monitor liquidity and intraday volatility for potential rapid moves.
- Monitor broader market breadth and BTC dominance as contextual signals for risk-on/risk-off shifts.
- Confirm alignment of TA with price action before positioning with high conviction.
Hashtags: #ADA #Cardano #CryptoTA #MarketAnalysis #ETFFlows #BTC #ETH #MarketSnapshot #TechnicalAnalysis #TradingSignals #CryptoMarkets