Market Snapshot
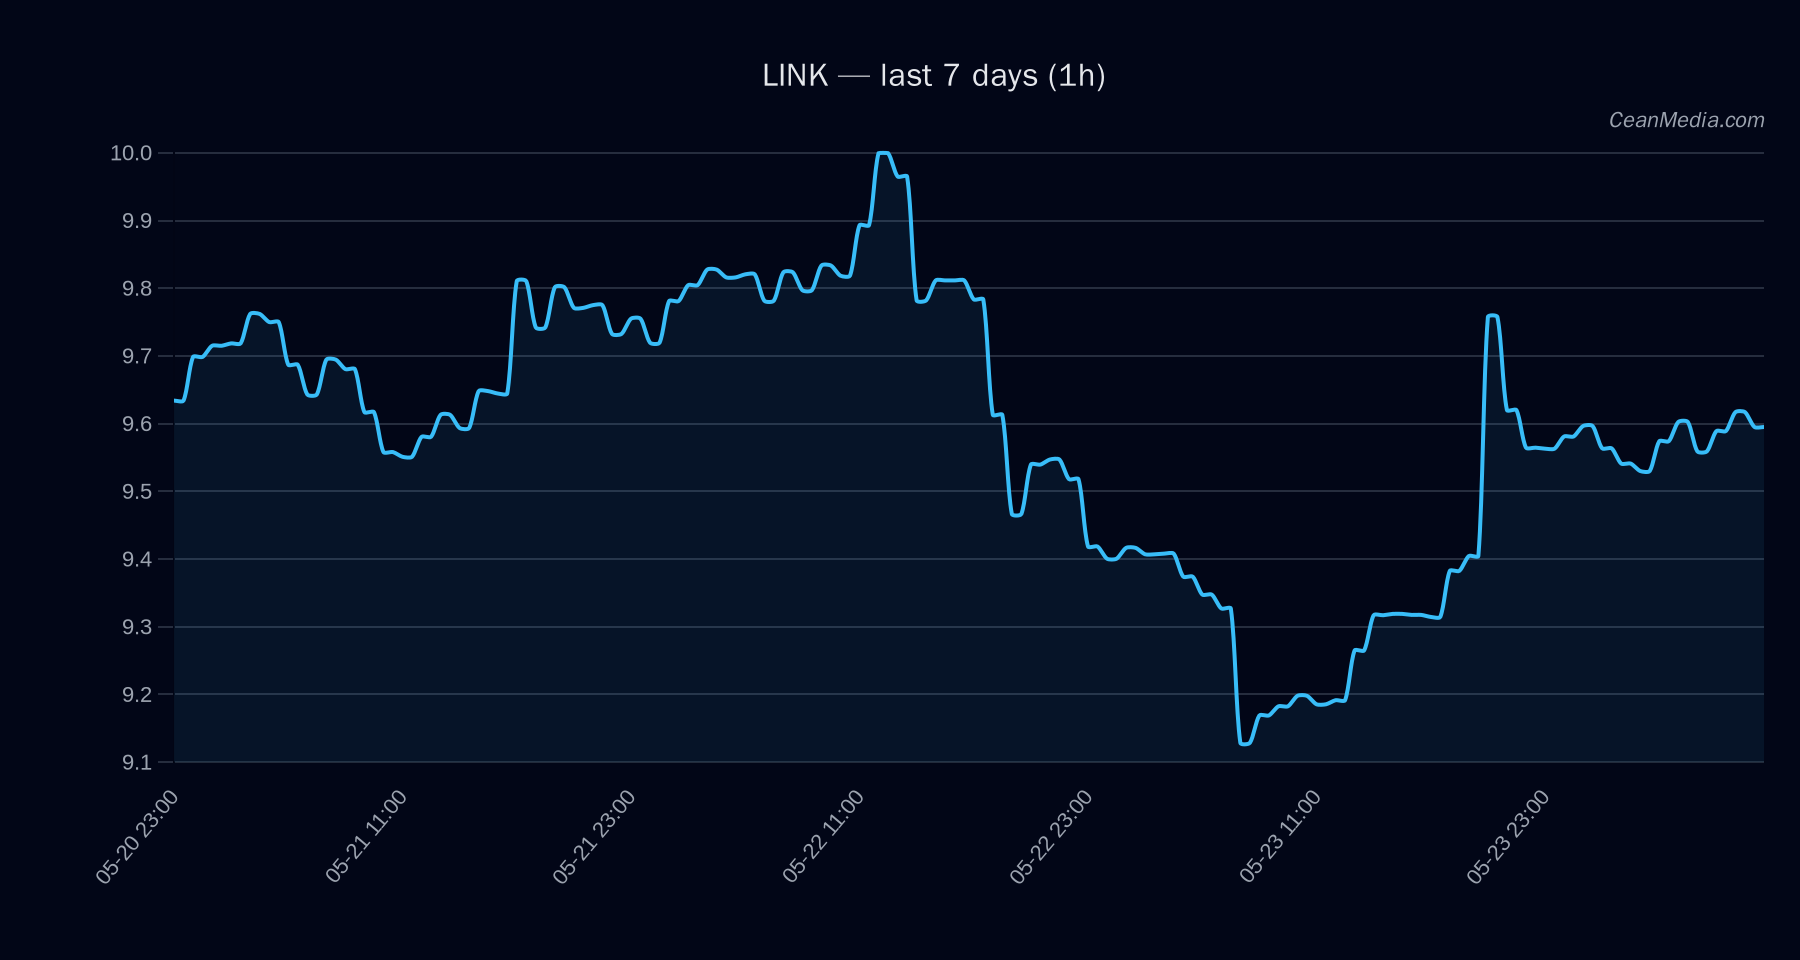
As of 2026-05-24, LINK trades around a narrow range with a close near 9.59. The model indicates a down bias with mixed conviction, while price action remains in a sideways range. Overall market context shows very low volatility and a macro backdrop of cautious risk-off sentiment, reinforced by extreme fear indicators and broad cross-asset softness.
Technical Analysis: LINK
-2.1 (conflicts 2). - EMA12 > EMA26 and SMA50 < SMA200.
- Volatility regime: Very low; σ24h 0.87%.
- Current forecast: down (67%), with 22% up and 11% sideways.
P50 9.2488; P20-P80 8.7742 – 10.1357. Support near 9.4 (major 9.48); Resistance near 9.78 (major 10.5). - Up: 1h close > 9.78 -> 9.9764 / 10.172
- Down: 1h close < 9.4 -> 9.2093 / 9.0213
Drivers
Spread BP (-2.52), LS Global Z-Score (-2.55), Stable Market Cap (0.93), LS Top Z-Score (-2.1), LIQ to OI EMA12 (2.69), BTC Dominance (1.59). Momentum shows slight sideways tilt with low volatility; RSI neutral. Cross-market risk assets soft; stablecoin liquidity contracting; sentiment at extreme fear (25).
ETF Flows (BTC/ETH)
ETF flow context from BTC and ETH ETFs shows cash inflows, suggesting a risk-on bid in broader equity and crypto-backed instruments. Note: ETF data here is BTC/ETH-centric and is presented as context rather than a primary signal for LINK. The flows may reflect general risk appetite shifts rather than asset-specific catalysts for LINK.
1D +$629.8M; 5D +$198.4M; 10D +$585.2M. 1D +$101.2M; 5D -$20.8M; 10D +$81.6M.
What to Watch Next
- Watch for a daily close above 9.78 to confirm potential upside continuation toward 9.9764–10.172.
- Alternatively, a close below 9.4 would open downside targets around 9.21–9.02.
- Monitor the BTC/ETH ETF flow environment as a gauge of risk-on/off sentiment that can spill over into altcoins like LINK.
- Keep an eye on volatility regime and market breadth signals for any structural change in risk appetite.
Hashtags: #LINK #crypto #marketanalysis #tradingview #technicalanalysis #ETFlows #BTC #ETH #riskon #volatility #altcoins #crypto2026