Market Snapshot
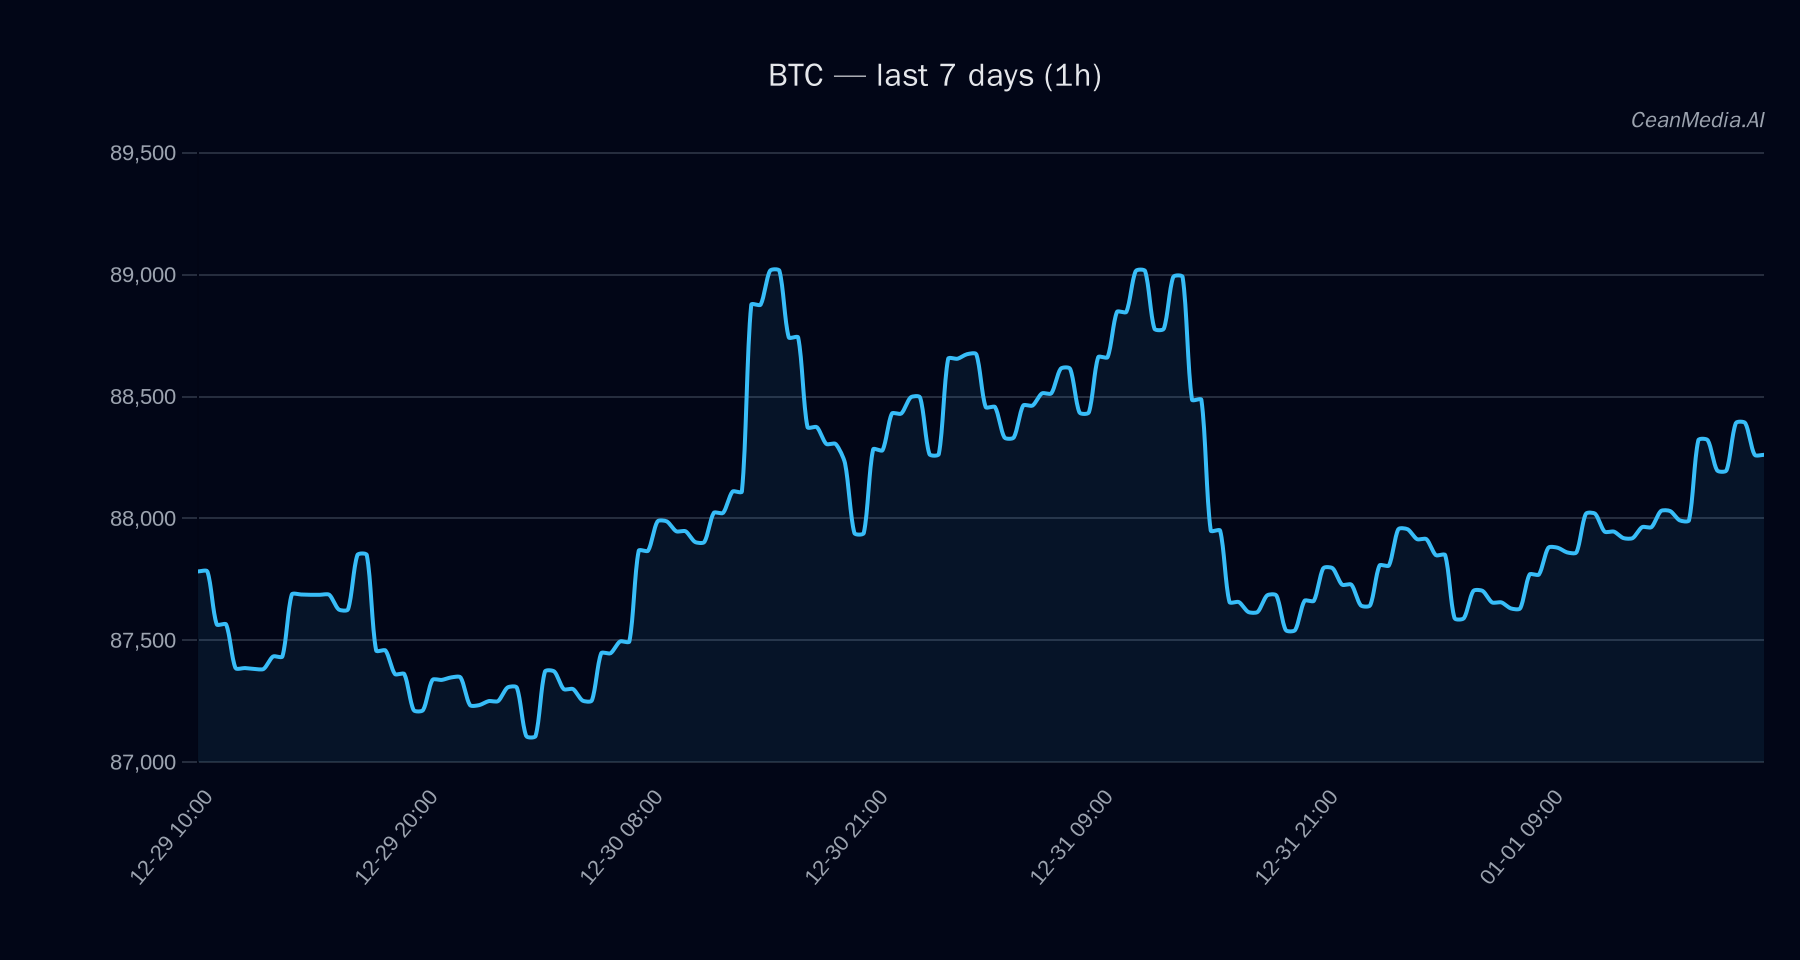
As of January 2, 2026, Bitcoin (BTC) is trading within a defined support and resistance zone, with the current price around $88,371. The overall market sentiment remains cautious, with very low volatility and a slight risk-off tone reflected in recent ETF flows. The broader market breadth exceeds 50%, and the 72-hour correlation with recent price movements remains near perfect, indicating sustained momentum.
Technical Analysis: BTC
- Levels to Watch: Support at approximately $86,600 (near-term support) and $87,300 (major support). Resistance levels are at $88,900 (major) and $90,150 (near-term). A break above $90,150 could propel prices towards $91,941 and potentially up to $93,744. Conversely, a decline below $86,600 could see prices drop to between $84,872 and $83,140.
- Bias & Indicators: The technical bias is bullish, supported by EMA12 being above EMA26, SMA50 above SMA200, and RSI at 61, indicating neutral to slightly bullish momentum. The short-term forecast leans towards a downward move with a 47% probability, but overall trend strength remains positive.
- Triggers & Invalidation: A decisive move above 90,150 would confirm bullish continuation, while a breakdown below 86,600 would invalidate the bullish case and suggest further downside.
Drivers
- Top Factors: The 24-hour return remains minimal at approximately 0.56%, with the EMA slope nearly flat, indicating a steady trend. The funding Z-score is negative at -1.12, suggesting slight bearish pressure, while order-book imbalances favor downside movement. Trend strength remains moderate at around 1.03.
- Market Sentiment & Volatility: Volatility regime remains very low, with the implied volatility index (σ24h) at 0.14%, reflecting subdued trading activity. Market breadth is healthy at 83%, but extreme fear remains prevalent, with an F&G score of 20.
ETF Flows (BTC/ETH)
Recent ETF flow data shows significant outflows from Bitcoin and Ethereum ETFs, with BTC ETFs experiencing -$85.4 million in one day, -$423.1 million over five days, and -$655 million over ten days. ETH ETFs have also seen outflows, though less pronounced. These flows suggest a cautious or risk-off environment, but it is important to note that ETF data is only available for BTC and ETH and should be considered as context rather than primary signals for Bitcoin’s immediate direction.
What to Watch Next
- Monitor the price action around the key support at $86,600 and resistance at $90,150 for potential breakout or breakdown signals.
- Watch upcoming macroeconomic developments and market sentiment indicators for clues on risk appetite, especially given the recent ETF outflows.
- Keep an eye on the trend strength and volume regimes, as very low volatility could precede a significant move.
- Evaluate broader market breadth and correlation metrics for signs of systemic shifts or divergences.
Hashtags: #Bitcoin #CryptoAnalysis #MarketUpdate #BTC2026 #CryptoTrends #TradingStrategy #TechnicalAnalysis #ETFFlows #MarketSentiment #CryptoNews #FinancialMarkets #DigitalAssets