Market Snapshot
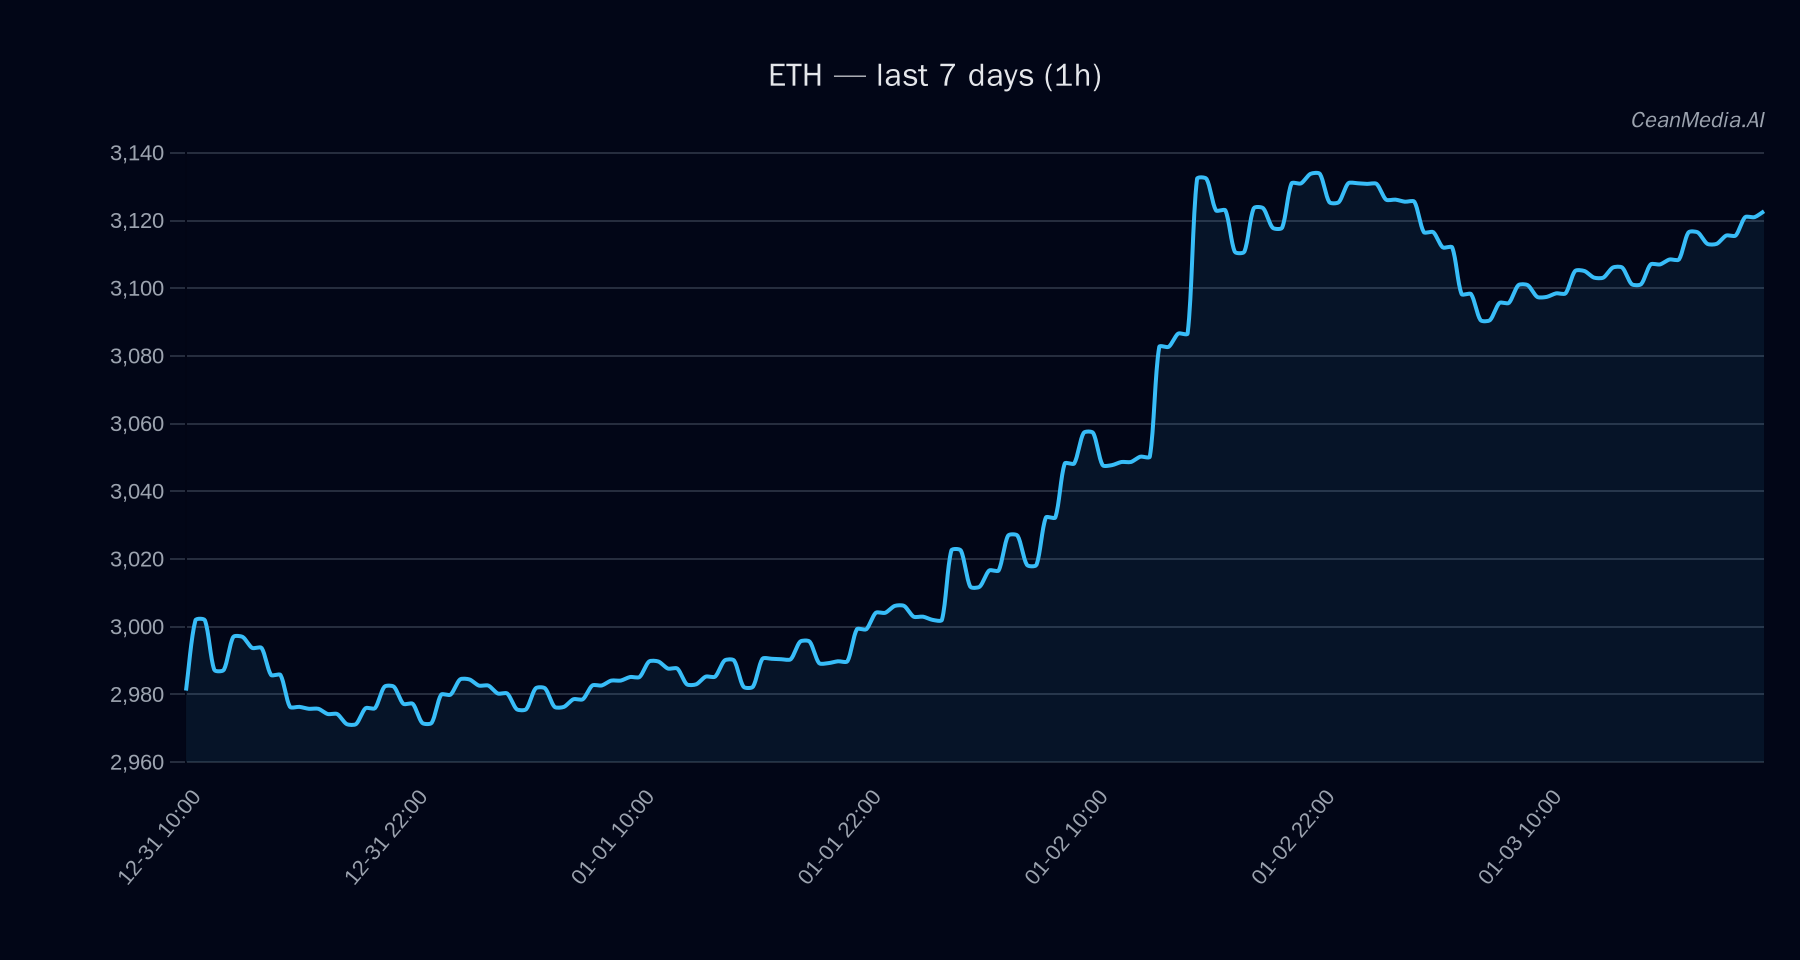
As of early January 2026, Ethereum (ETH) trades around the $3,120 level, with a short-term bias leaning towards sideways movement. Market breadth remains high, with a 100% bullish reading, supported by strong correlations with Bitcoin (BTC). ETF flows show positive momentum for both BTC and ETH over the past 24 hours, indicating continued institutional interest. Overall, the market environment remains cautious amid low volatility regimes and a mixed macro backdrop.
Technical Analysis: ETH
ETH is currently situated between key support at approximately $3,060 and resistance near $3,186. A break above the resistance zone could propel the price toward $3,249–$3,313, while a decline below support may see it test levels around $2,938–$2,999. The short-term technical bias appears bullish, with EMA12 above EMA26, SMA50 above SMA200, and RSI at 64, indicating neutral momentum. The current volatility is very low, and the market’s recent signals suggest a cautious stance pending clearer directional triggers.
Drivers
- Return 24H: +0.65%
- EMA Slope: Slight upward trend (+0.0004)
- Funding Z-Score: -0.67, indicating slight funding pressure
- Basis Z-Score: -0.44, reflecting modest basis deviation
- Order Book Imbalance (EMA5): +0.17, suggesting mild buying interest
- BTC Return 24H: +0.86%
- Market Volatility Regime: Very low, supporting sideways consolidation
Momentum remains steady with limited volatility, while the correlation with Bitcoin continues to influence ETH’s short-term trajectory. Market sentiment shows cautious optimism, but no strong breakout signals are currently evident.
ETF Flows (BTC/ETH)
Recent ETF flow data reveals continued institutional activity: BTC ETFs saw a net inflow of +$91.3 million over one day, while ETH ETFs experienced a smaller but positive inflow of +$127.3 million. Over five days, BTC ETF flows turned negative, totaling -$419.2 million, and over ten days, cumulative outflows reached -$1.28 billion. Conversely, ETH ETF flows over five days remain positive at +$71.2 million, with a slight outflow over ten days. These flows suggest a nuanced risk-on environment, with ETH attracting interest despite broader macro uncertainties. It’s important to note that ETF data is only available for BTC and ETH and should be considered as contextual rather than primary trading signals.
What to Watch Next
- Monitor for a breakout above $3,186 to confirm bullish continuation toward $3,249–$3,313.
- Watch support levels around $3,060; a close below this could trigger a move toward $2,938–$2,999.
- Keep an eye on ETF flow trends, especially any sustained inflows for ETH, signaling institutional confidence.
- Observe macroeconomic developments and Bitcoin’s performance, as they continue to influence ETH’s short-term outlook.
Hashtags: #Ethereum #CryptoAnalysis #ETH #MarketUpdate #CryptoFlows #ETF #TechnicalAnalysis #Bitcoin #Altcoins #CryptoTrends #Investment #Blockchain