Market Snapshot
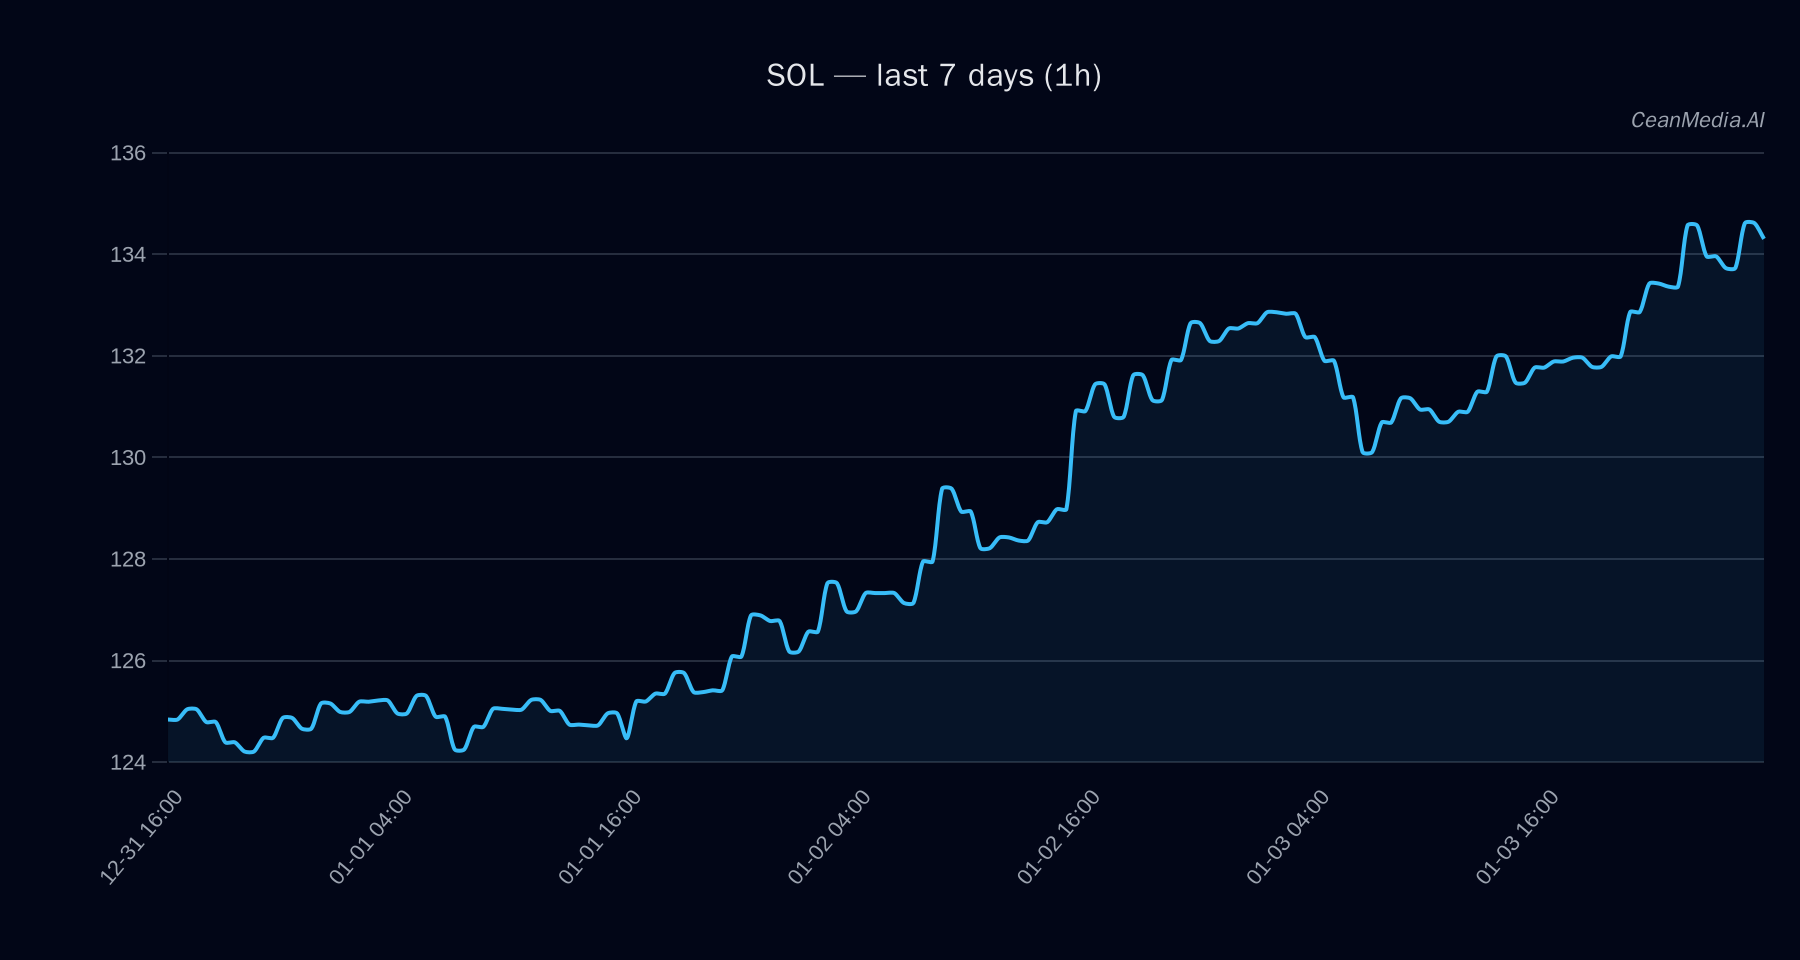
On January 4, 2026, Solana (SOL) is trading around $134.55 with a neutral short-term forecast. Market sentiment remains cautiously bullish with key technical indicators supporting a sideways to slight upward bias. Broader crypto market flows, particularly in Bitcoin and Ethereum ETFs, provide additional context for risk appetite in the current environment.
Technical Analysis: SOL
Solana is currently situated between support at approximately $132 and resistance at around $137. A breakout above $137 could propel SOL towards the range of roughly $140 to $143, while a move below $132 may see declines toward $126 to $129. The technical signals show a bullish bias:
- EMA12 is above EMA26, indicating short-term momentum is positive.
- SMA50 surpasses SMA200, supporting a longer-term bullish trend.
- RSI is at 68, approaching overbought levels but still within neutral territory.
- Market volatility remains very low, suggesting a consolidation phase.
The probability of a near-term upward move is approximately 48%, with a similar likelihood for sideways or downward movement.
Drivers
The primary drivers influencing SOL include:
- 24-hour return at 0.02%, indicating minimal recent price change.
- EMA slope remains positive at 0.0005, supporting current bullish momentum.
- Funding Z-Score at -0.21 and Basis Z-Score at -0.65 reflect neutral to slightly bearish funding conditions.
- Order-book imbalance (EMA5) is positive at 0.03, indicating buying interest.
- Bitcoin’s 24-hour return of 0.01% and its trend strength of approximately 1.66 suggest a stable macro environment for altcoins.
Overall, momentum indicators favor a cautious bullish outlook, but low volatility and neutral funding signals suggest traders should watch for confirmation of breakout levels.
ETF Flows (BTC/ETH)
Recent ETF flow data for Bitcoin and Ethereum show mixed risk sentiment. Bitcoin ETFs experienced inflows of approximately $471.3 million over the past day but have seen consistent outflows over the past 5 and 10 days, totaling around $903.7 million. Conversely, Ethereum ETFs have experienced positive inflows of $174.5 million in one day and continued smaller inflows over the 5-day period, with slight outflows in 10 days. These flows indicate a short-term risk-on sentiment in the broader crypto market, predominantly driven by institutional interest in ETH, while Bitcoin shows signs of profit-taking or rotation.
What to Watch Next
- Break above resistance at $137 to confirm bullish continuation.
- Close below support at $132 to signal potential downside momentum.
- Monitor Bitcoin and Ethereum ETF flows for changes in risk appetite.
- Watch for macroeconomic factors or regulatory developments that could impact market sentiment.
Note: ETF flow data for BTC and ETH provides market context but is not a primary indicator for SOL’s price direction.
Hashtags: #Solana #CryptoAnalysis #MarketUpdate #BTC #ETH #ETFFlows #TechnicalAnalysis #CryptoTrends #Altcoins #Investing #Blockchain #CryptoNews