Market Snapshot
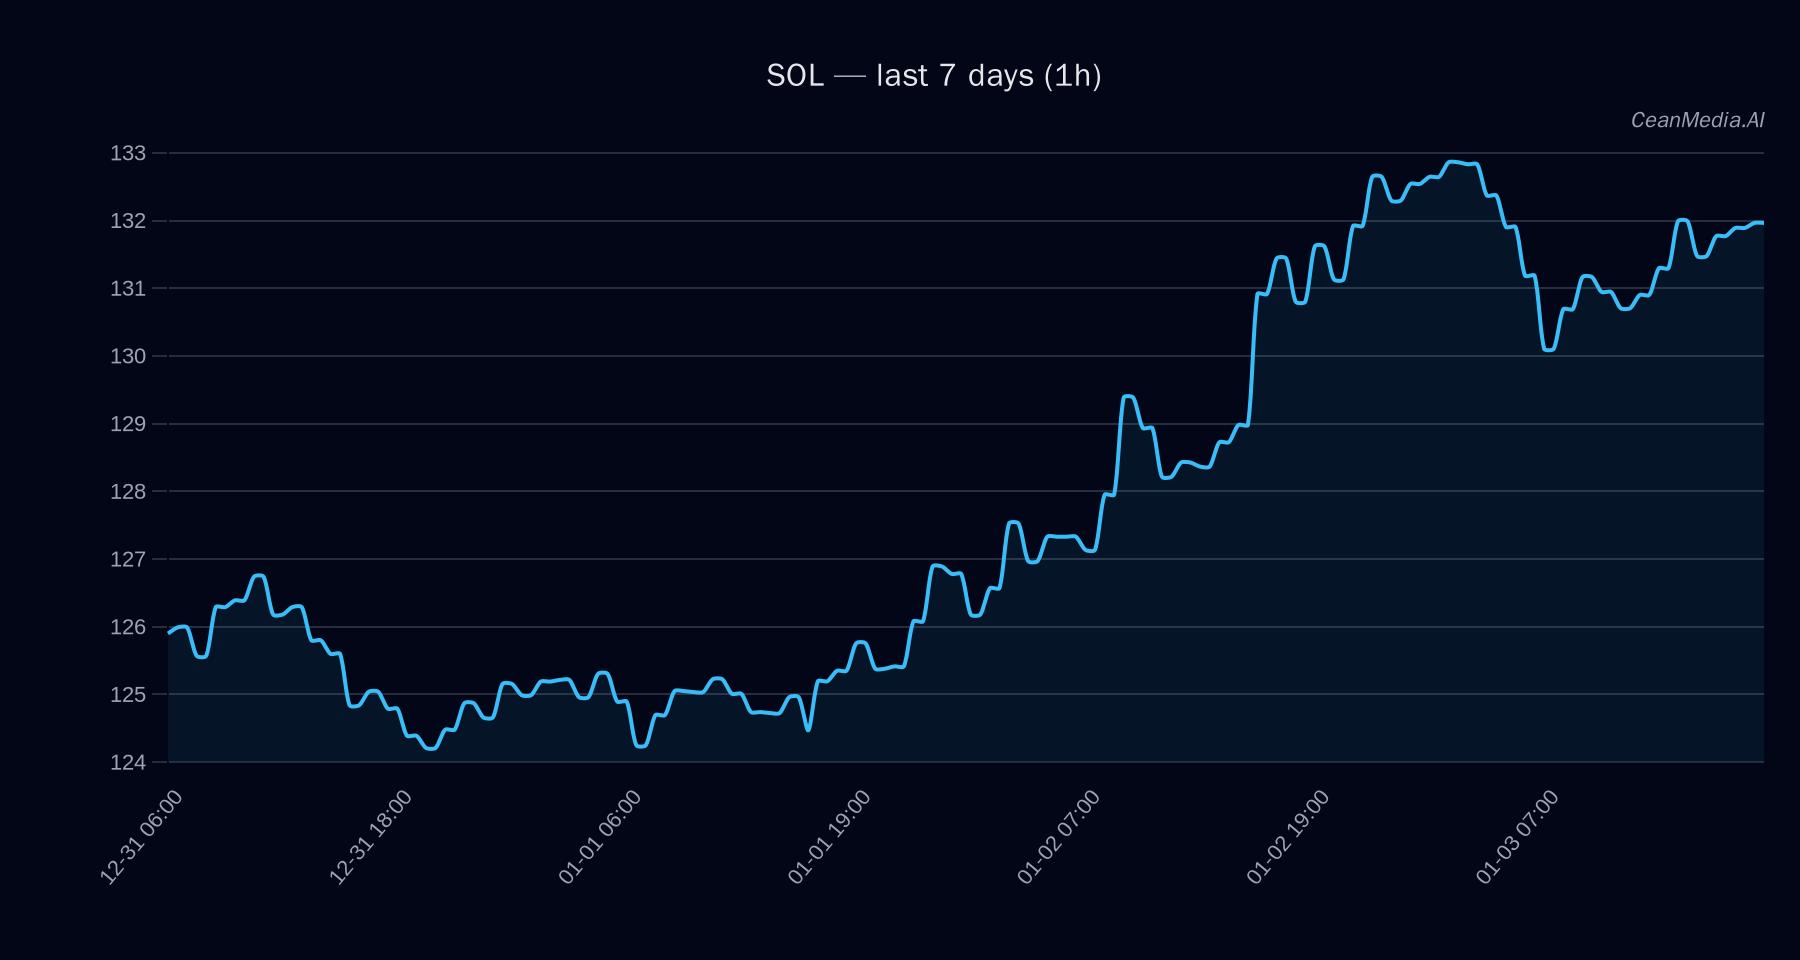
As of January 4, 2026, Solana (SOL) is trading around $132, with a mixed outlook influenced by technical patterns and broader ETF flow dynamics. The cryptocurrency remains within a defined support and resistance zone, with recent trading activity showing minimal volatility and a cautious market sentiment.
Technical Analysis: SOL
- Levels to Watch: Support at approximately $129 (near support), resistance at around $134 (near resistance). A decisive break above $134 could target levels between $137.09 and $139.78, while a break below $129 may see prices drop to between $126.55 and $124.00.
- Bias and Indicators: The technical setup suggests a bullish bias with EMA12 above EMA26, SMA50 above SMA200, and RSI at 57, indicating neutral momentum. The overall forecast leans towards sideways movement with a 49% probability of downside, supported by low volatility and a very low volatility regime.
- Invalidation Triggers: A close below $129 could invalidate bullish signals and suggest further downside, whereas a close above $134 would reinforce the bullish breakout scenario.
Drivers
- Top Factors: The 24-hour return remains marginal at 0.0059, with a slight positive momentum. The EMA slope indicates a very gradual upward trend, while the funding and basis Z-scores are negative, reflecting slight bearish funding conditions. Order book imbalance remains neutral.
- Market Momentum and Volatility: Bitcoin’s 24-hour return of 0.3% and trend strength of approximately 0.53 support a modest risk-on environment. Overall, the market exhibits very low volatility, aligning with the subdued price action observed in SOL.
ETF Flows (BTC/ETH)
Recent ETF flow data indicates a mixed risk sentiment. Bitcoin ETFs have seen a positive inflow of +$91.3 million in one day but a significant outflow of -$419.2 million over five days and -$1.28 billion over ten days, suggesting caution among traders. Conversely, Ethereum ETFs experienced a positive inflow of +$127.3 million in one day and +$71.2 million over five days, with a minor outflow over ten days.
While these flows are only for BTC and ETH, they provide context for the broader risk appetite. The net inflows in ETH suggest a slightly risk-on environment, which could indirectly influence altcoins like SOL, but should not be solely relied upon for SOL-specific trading decisions.
What to Watch Next
- Monitor the price action around the key support at $129 and resistance at $134 for potential breakout signals.
- Observe any changes in Bitcoin and Ethereum ETF flows for shifts in overall market risk sentiment.
- Keep an eye on technical momentum indicators, especially RSI and moving averages, for signs of trend reversals or accelerations.
- Watch broader macroeconomic developments and market liquidity conditions that could impact volatility and sentiment.
Note: ETF flow data pertains only to BTC and ETH and serves as contextual information rather than a primary indicator for SOL.
Hashtags: #Solana #CryptoAnalysis #BTC #ETH #ETFFlows #MarketUpdate #Altcoins #TechnicalAnalysis #CryptoTrends #Blockchain #Investing #CryptoNews