Market Snapshot
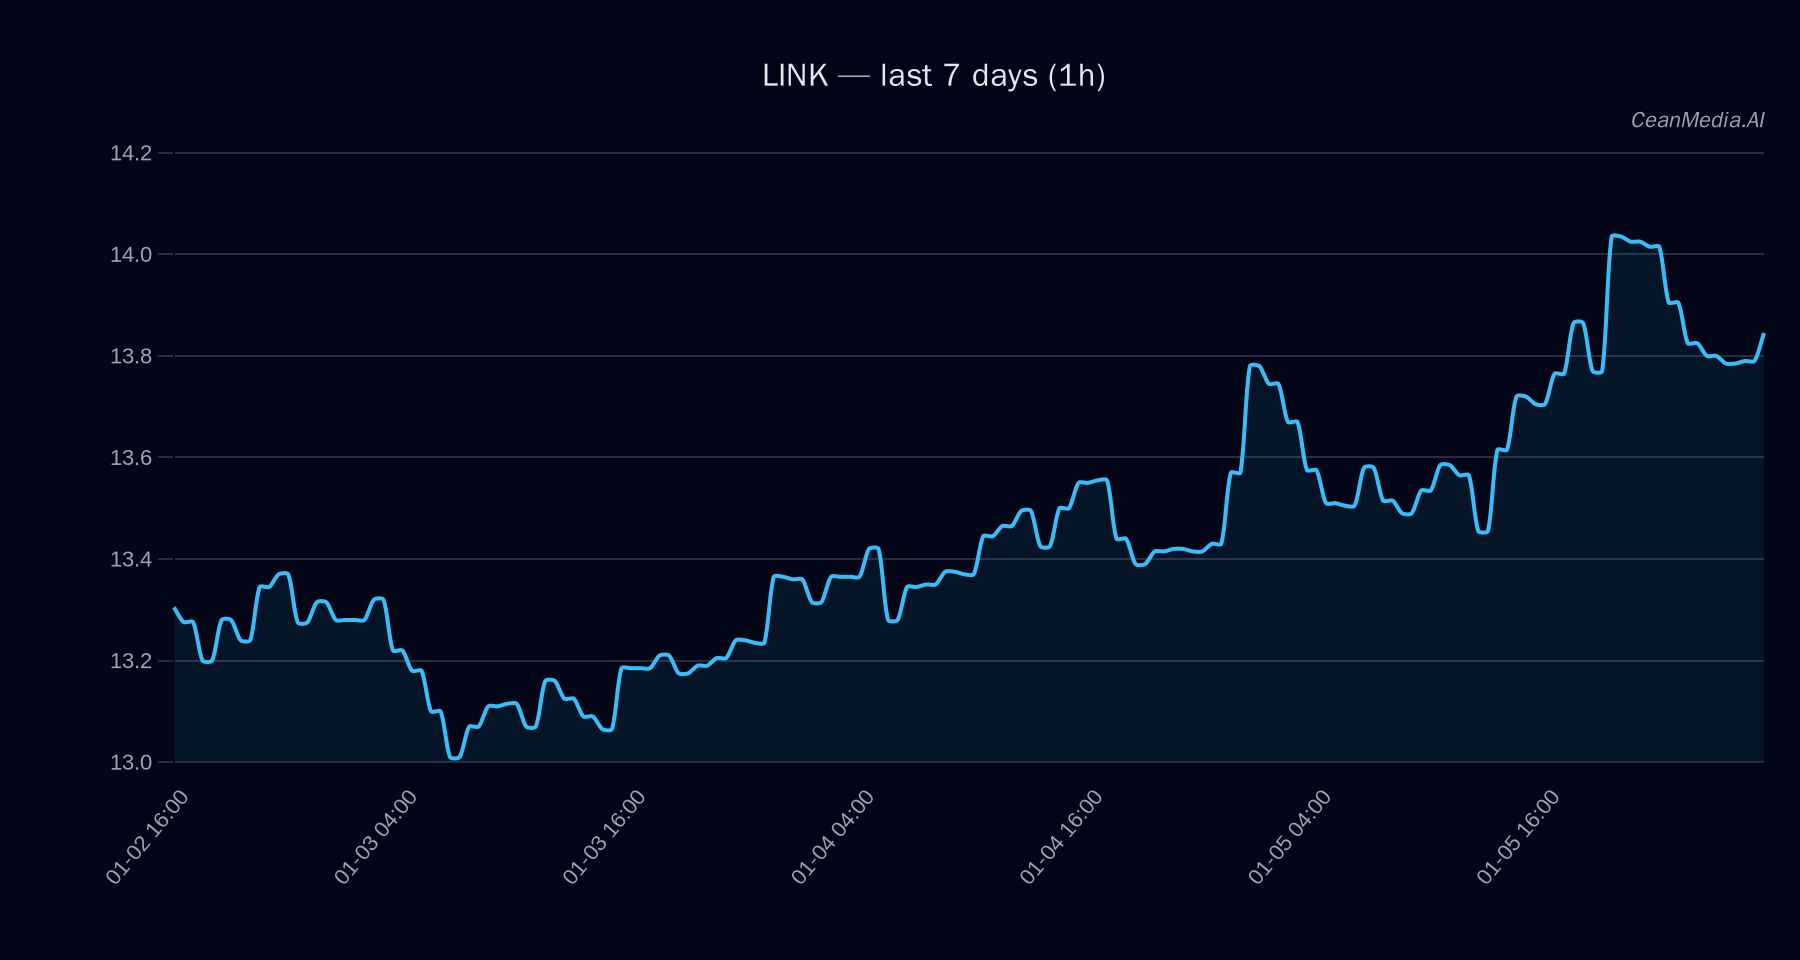
As of January 6, 2026, LINK trades around $13.87 with a neutral to slightly bearish short-term bias. The broader crypto market shows stable ETF flows, with Bitcoin and Ethereum ETFs experiencing inflows over the past week, indicating a risk-on sentiment in traditional markets. However, LINK remains influenced primarily by technical levels and on-chain dynamics.
Technical Analysis: LINK
LINK is currently trading between key support at approximately $13.6 and resistance near $14.1. A breakout above $14.1 could target levels around $14.43 to $14.71, signaling potential upside. Conversely, a decline below $13.6 might lead to tests near $13.05 to $13.32. The technical indicators suggest a bullish trend with EMA12 above EMA26, and the SMA50 above SMA200, complemented by RSI at 58, indicating neutral momentum. The overall bias remains cautious with a 49% probability of downside, but the bullish TA signals are still valid until invalidated by a break below support.
Drivers
- Return 24H: Slight positive at 0.01%
- EMA Slope: Mild upward slope at 0.0002, indicating slight bullish momentum
- Funding Z-Score: 0.88, suggesting relatively stable funding conditions
- Order Book Imbalance (EMA5): Slight buy-side imbalance at 0.01
- BTC Return 24H: Minimal at 0.0011%, reflecting stable market conditions
- Market Volatility Regime: Very low, indicating subdued price fluctuations
- Market Sentiment: Fear index at 44, implying cautious optimism
Overall, the momentum remains modest with low volatility, supporting a neutral stance in the near term.
ETF Flows (BTC/ETH)
Recent ETF data shows strong inflows into Bitcoin and Ethereum ETFs, with Bitcoin ETFs gaining approximately $92.4 million daily and $329.1 million over five days. Ethereum ETFs also experienced inflows totaling $43.3 million daily and $200.4 million over five days. These flows suggest a risk-on environment among institutional investors, which can positively influence broader crypto sentiment. However, it is important to note that these ETF flows are only indicative of BTC and ETH market dynamics and should not be solely relied upon for LINK’s short-term outlook.
What to Watch Next
- Monitor the key support at $13.6 and resistance at $14.1 for potential breakout signals
- Watch for a sustained move above $14.1 to confirm bullish momentum
- Observe the broader market ETF flows for signs of risk appetite or aversion
- Keep an eye on on-chain metrics and macro factors that could influence LINK’s trend
Note: ETF flows for BTC and ETH provide contextual market sentiment but are not primary indicators for LINK’s immediate direction.
Hashtags: #CryptoAnalysis #LINK #Bitcoin #Ethereum #MarketUpdate #TechnicalAnalysis #ETFFlows #CryptoTrends #TradingStrategy #MarketSentiment #Blockchain #Investing