
Market Snapshot
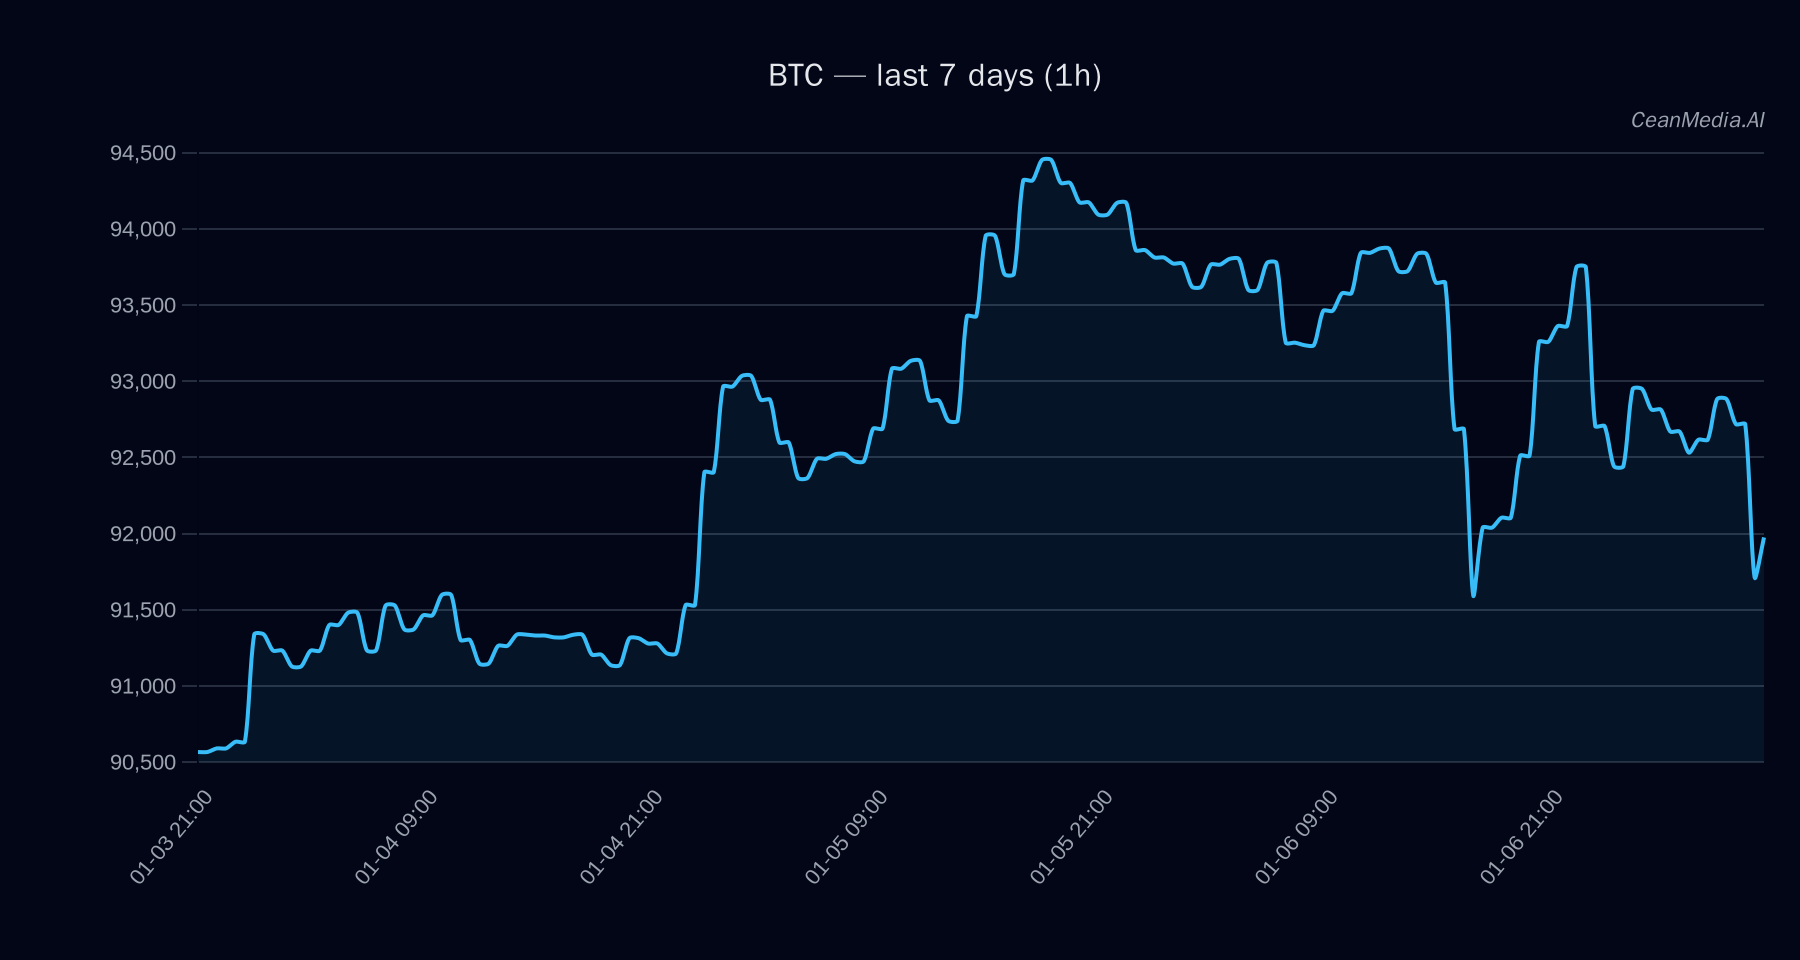
As of January 7, 2026, Bitcoin (BTC) is trading around $92,164, with a short-term outlook leaning towards sideways movement. The current technical signals indicate a slight bearish bias, with key support at approximately $90,325 and resistance near $94,000. Recent ETF flows show contrasting investor sentiment between Bitcoin and Ethereum, providing additional context for market dynamics.
Technical Analysis: BTC
- Levels: Support at $90,325 (major), resistance at $94,000 (major). A break above $94,000 could target between $95,888 and $97,768; a break below $90,325 could see prices decline to between $86,708 and $88,514.
- Bias: Slightly bearish with a sideways trend indicated by EMA12
- Triggers: Upside break above $94,000 would signal potential for near-term rally; downside break below $90,325 suggests further decline.
- Invalidation: The current pattern remains valid unless price breaches key support at $90,325 or resistance at $94,000.
The technical indicators show a neutral RSI and a trend strength of approximately 0.76, with minimal recent volatility, supporting a cautious stance on directional bias.
Drivers
- Top factors: Return over 24 hours is nearly flat at -0.01%, with a slight negative momentum in recent BTC returns.
- Market momentum: EMA slope remains negative, indicating a mild downward trend, while funding and basis Z-scores are neutral to slightly positive.
- Volatility and sentiment: Vol regime is very low, with fear index at 42, suggesting investor caution. BTC dominance has decreased marginally by 0.9% over the past week.
ETF Flows (BTC/ETH)
Recent ETF flow data reveals a contrasting investor appetite: Bitcoin ETFs experienced a significant outflow of approximately $243.2 million in one day, but a net inflow of $710 million over five days, indicating short-term volatility and cautious risk appetite. Conversely, Ethereum ETFs have seen consistent inflows, totaling about $447.8 million over five days, reflecting a risk-on sentiment towards ETH. This ETF activity should be viewed as context rather than a primary directional signal for BTC.
What to Watch Next
- Monitor key support at $90,325 and resistance at $94,000 for potential breakout or breakdown signals.
- Observe ETF flow trends for ETH and BTC to gauge investor risk appetite and market sentiment shifts.
- Keep an eye on macroeconomic developments and broader crypto market liquidity, which could influence short-term volatility.
- Watch for any technical triggers that could accelerate price movement beyond established support/resistance levels.
Hashtags: #Bitcoin #CryptoAnalysis #BTC #MarketUpdate #ETFFlows #CryptoTrends #TechnicalAnalysis #CryptoNews #MarketSentiment #CryptoInvesting #DigitalAssets #CryptoResearch