Market Snapshot
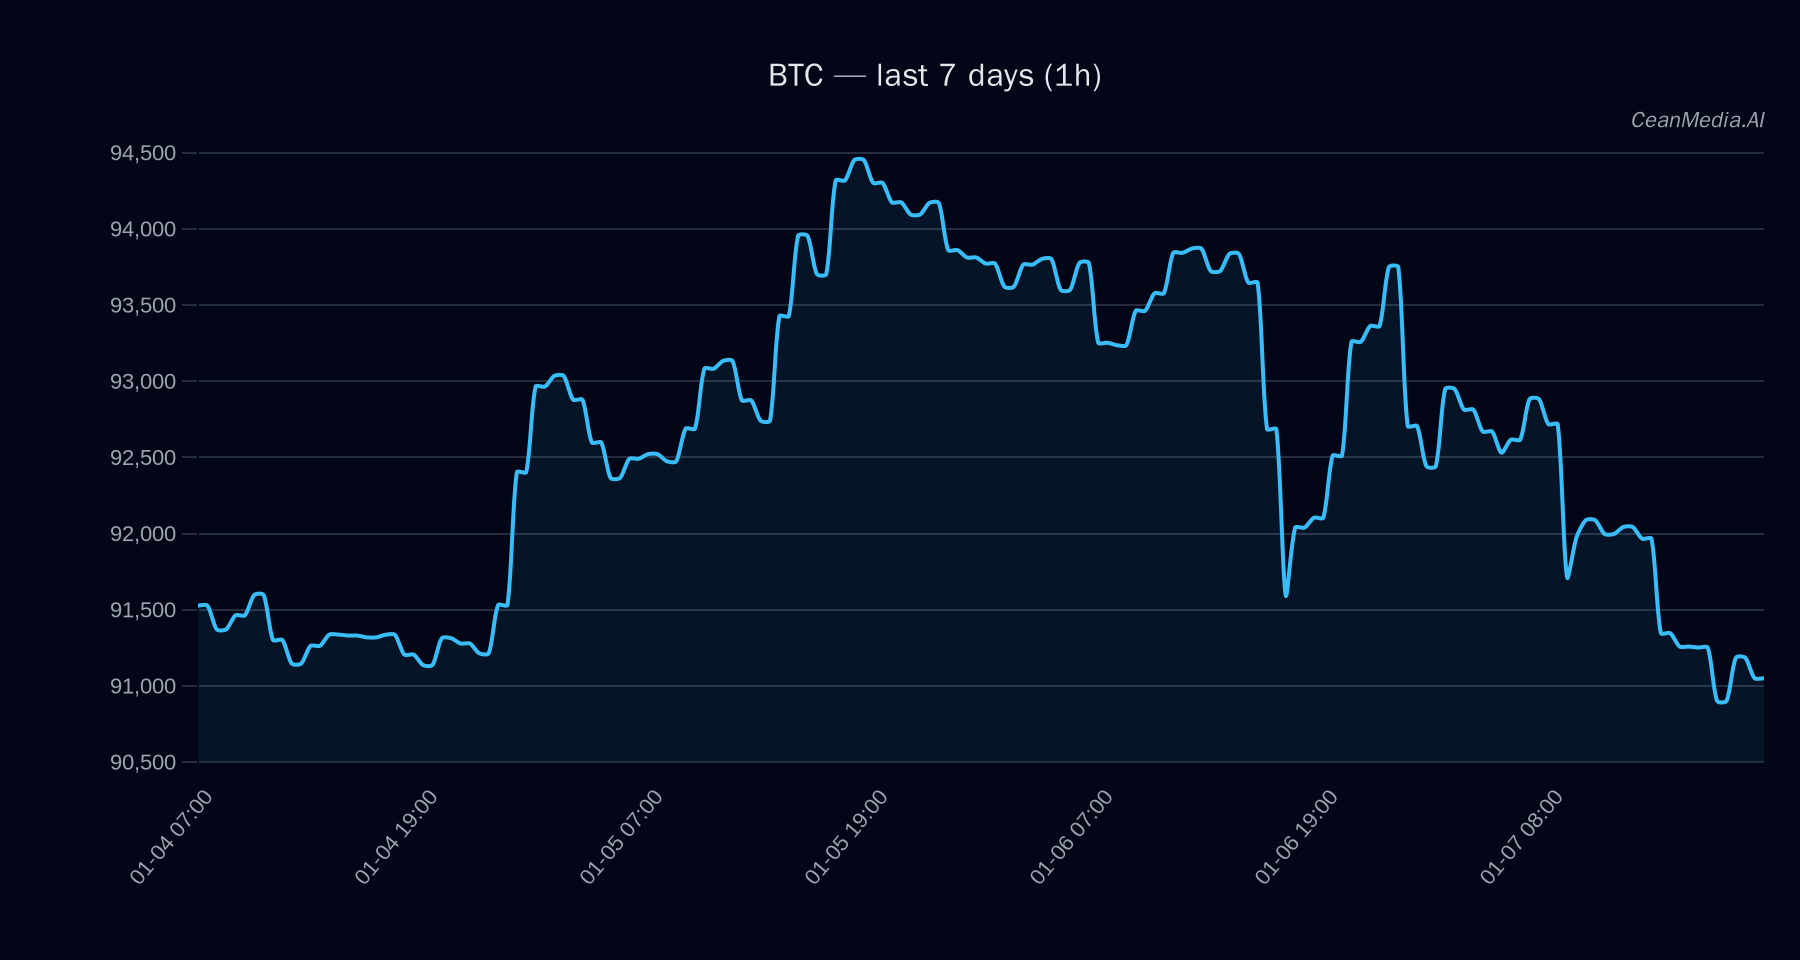
As of January 8, 2026, Bitcoin (BTC) trades around the 91,209 USD level, with a short-term bias towards sideways movement. The current market sentiment indicates low volatility conditions, with a very low volume regime and a neutral RSI of 37. The broader market remains cautious, with a slight downward trend evident from recent price actions.
Technical Analysis: BTC
- Key Levels: Support is identified at approximately 89,375 USD, while resistance stands near 93,025 USD. A decisive break above resistance could target levels around 94,894 to 96,755 USD, whereas a move below support might see prices drop to approximately 87,597 to 85,810 USD.
- Bias and Triggers: The current technical indicators suggest a sideways bias with a 42% probability of downward movement within the short term. The EMA12 remains below EMA26, and the SMA50 is above SMA200, indicating a cautious outlook. A close above 93,025 USD would be a bullish trigger, while a close below 89,375 USD would suggest further downside.
- Invalidation: The invalidation of the sideways outlook occurs if the price decisively breaks above 93,025 USD or below 89,375 USD, confirming potential trend continuation in either direction.
Drivers
- Market Momentum: The recent return over 24 hours is marginally negative at -0.02%, with trend strength at approximately 1.4, indicating limited momentum.
- Volatility & Sentiment: The volatility regime remains very low, and the funding Z-score (-0.68) suggests a neutral to slightly cautious sentiment. The basis Z-score (1.78) points to some technical divergence but no immediate overbought/oversold signals.
- Market Breadth & Imbalances: The order-book imbalance is modest, supporting a neutral outlook, with a correlation coefficient of 1.00 over 72 hours indicating strong recent price correlation.
ETF Flows (BTC/ETH)
Recent ETF flow data shows that Bitcoin ETFs experienced a decline of approximately 243 million USD over the past day, while inflows over the 5-day period total around 710 million USD. Conversely, Ethereum ETFs posted positive flows, with a 113 million USD increase in one day and cumulative inflows of 447.8 million USD over five days. These flows suggest a possible rotation of investor interest towards ETH, which could influence risk sentiment but should be considered as contextual rather than a primary signal for BTC price movements.
What to Watch Next
- Monitor the key support at 89,375 USD for potential downside triggers.
- Watch for a breakout above 93,025 USD to confirm bullish momentum.
- Observe ETF flow trends for ETH and BTC as they may influence overall market sentiment.
- Stay alert for changes in volatility and momentum indicators that could signal shifts in trend bias.
Hashtags: #Bitcoin #CryptoAnalysis #MarketUpdate #BTC #ETH #ETFFlows #TechnicalAnalysis #CryptoTrends #TradingSignals #MarketSentiment #FinancialMarkets #CryptoNews