Market Snapshot
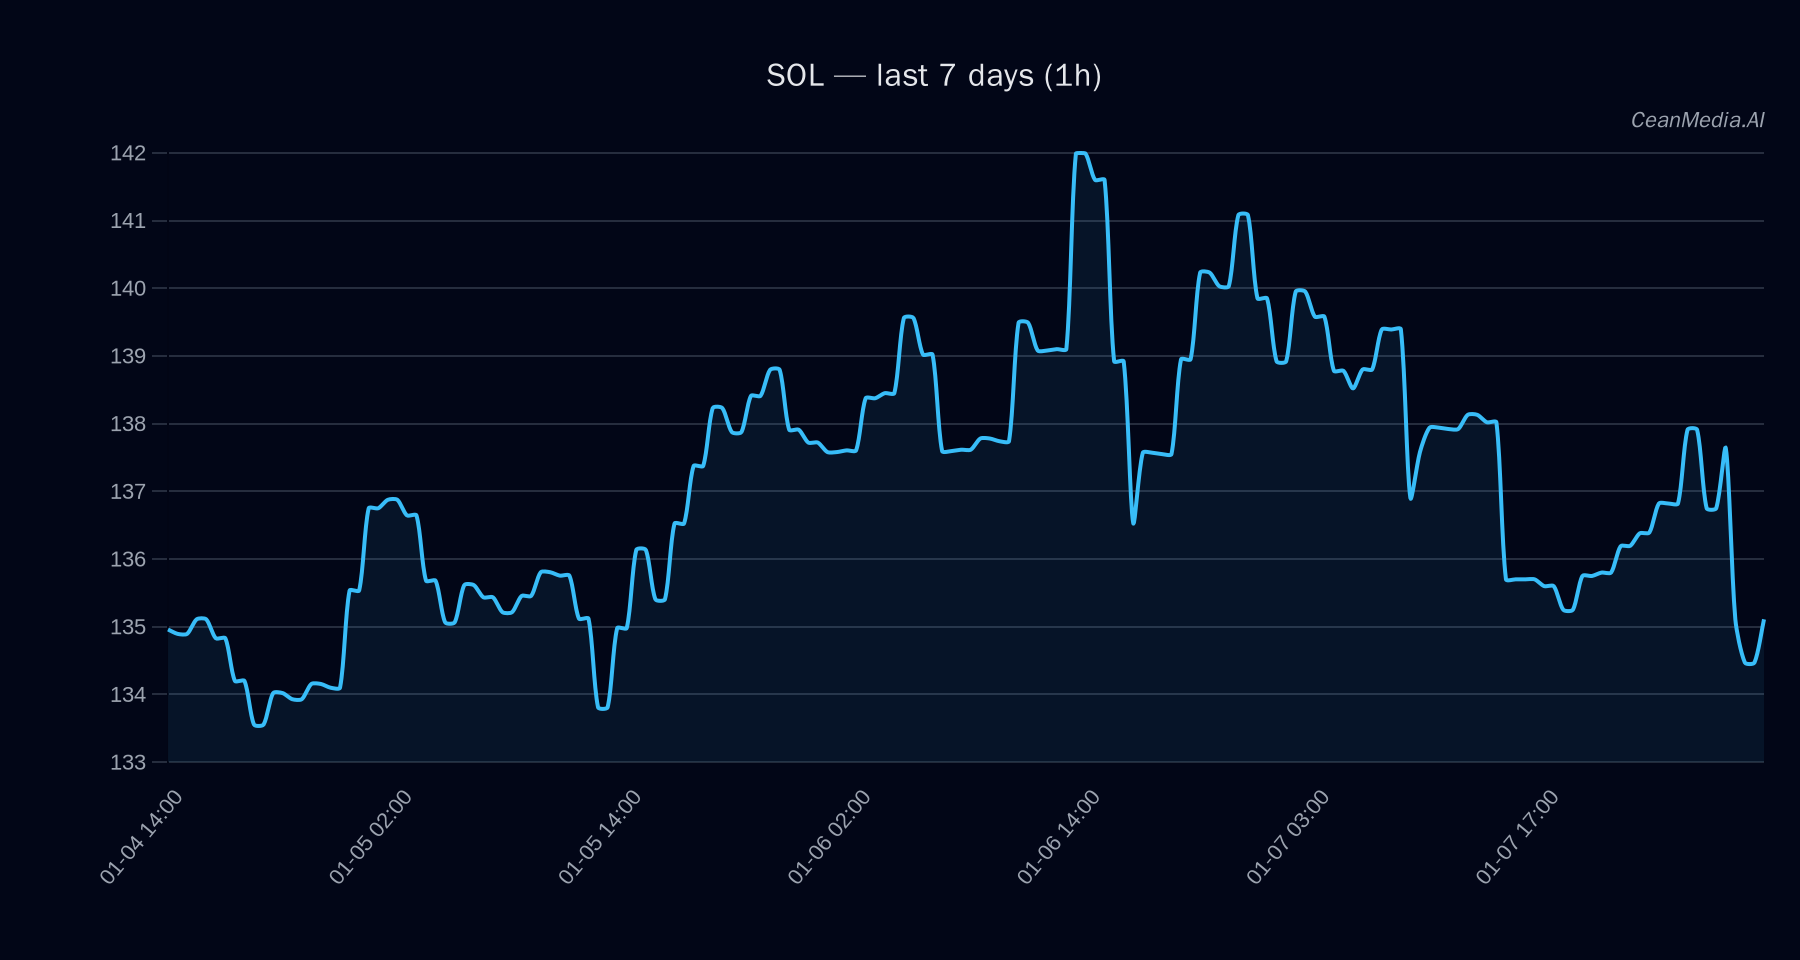
On January 8, 2026, Solana (SOL) is trading at approximately $135.11. The current technical outlook indicates a sideways to slightly bearish bias with a 48% probability of further decline over the next 24 hours. Market sentiment remains cautious, with very low volatility and neutral momentum indicators.
Technical Analysis: SOL
- Levels: Support at approximately $132 (near support), with a major support level at $125. Resistance is identified at $138, with a potential upside if price closes above this level.
- Bias: The technical signals suggest sideways movement, with EMA12 below EMA26, and SMA50 above SMA200, indicating a consolidation phase with no immediate trend dominance.
- Triggers: A close above $138 could push SOL towards $140.57–$143.32, while a close below $132 might see a decline towards $127.11–$129.76.
- Invalidation: Break below $125 would signal increased downside risk, invalidating the current support zone.
Drivers
- Top factors influencing SOL: 24H return at -0.02%, EMA slope slightly negative at -0.0014, funding and basis Z-scores negative indicating cautious market sentiment.
- Momentum and volatility: Market shows very low volatility (σ24h 0.72%), with trend strength around 0.56, suggesting a lack of strong directional momentum.
- Market sentiment: Fear index at 28, and Bitcoin dominance at 56.8%, indicating cautious risk appetite with some rotation into Bitcoin.
ETF Flows (BTC/ETH)
Recent ETF flow data shows Bitcoin ETFs experiencing a significant outflow of approximately $486 million over the past day, but with a modest inflow of $91 million over five days. Ethereum ETFs, on the other hand, have seen a daily outflow of $98 million, but positive net flows over five and ten days. These movements suggest a cautious risk environment, with some rotation away from Bitcoin in the short term, though longer-term flows remain positive. It is important to note that ETF flows for BTC and ETH serve as a broader risk-on/off indicator and are not direct signals for SOL price movements.
What to Watch Next
- Monitor SOL’s price action around the critical support at $132 and resistance at $138 for breakout signals.
- Watch for a close above $138 to confirm bullish momentum targeting $140.57–$143.32.
- Observe overall market sentiment and Bitcoin ETF flows for signs of risk appetite shifts that could influence SOL indirectly.
- Keep an eye on broader volatility and trend strength indicators for early signs of trend development.
Hashtags: #Solana #CryptoAnalysis #MarketUpdate #BTC #ETH #CryptoFlows #TechnicalAnalysis #CryptoTrends #Blockchain #Investing #Cryptocurrency #MarketInsights