Market Snapshot
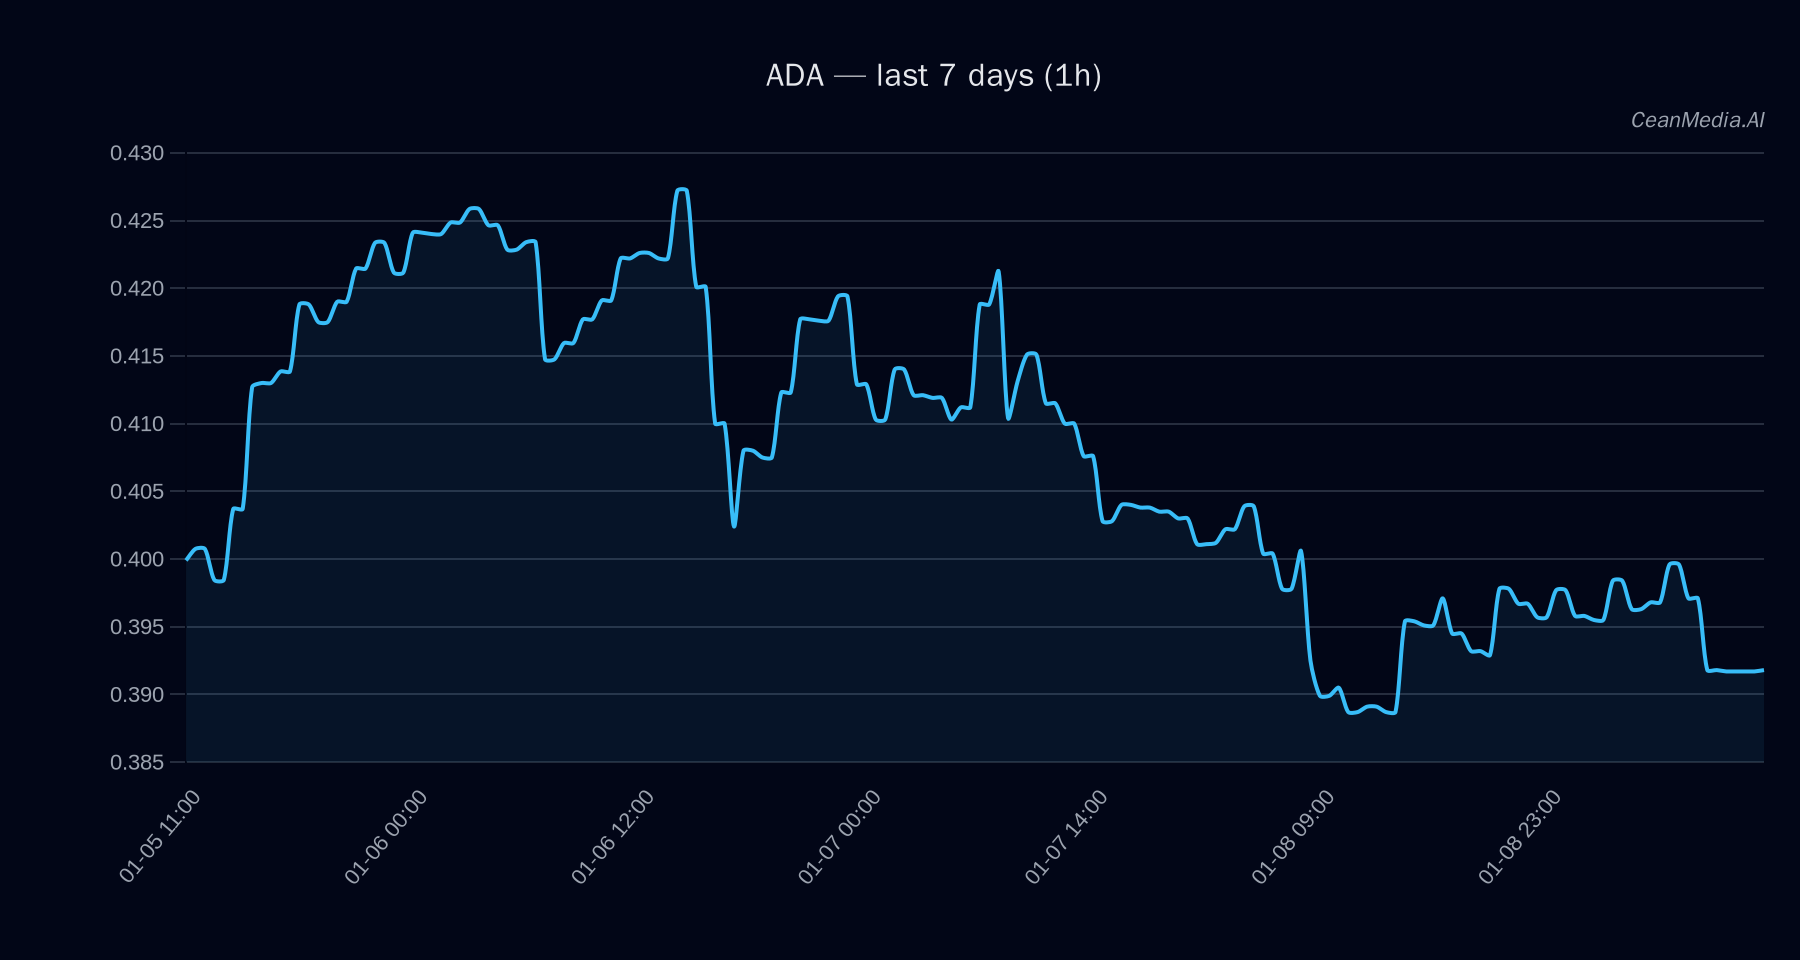
On January 9, 2026, Cardano (ADA) is trading around $0.392, with a short-term bias leaning towards a decline. The current technical indicators suggest sideways movement within established support and resistance levels. Broader market flows, particularly in BTC and ETH ETFs, provide additional context for risk sentiment, though they are not primary drivers for ADA’s immediate price action.
Technical Analysis: ADA
ADA is currently situated between a major support level at approximately $0.355 and a resistance near $0.41. A break above $0.40 could push prices toward the $0.4078–$0.4158 zone, while a decline below $0.385 might lead to a move toward $0.3765–$0.3688. The technical landscape indicates a sideways trend, with EMA12 below EMA26 and SMA50 above SMA200, signaling a cautious bias. The RSI at 41 remains neutral, and volatility is very low, reflecting subdued market activity. The probability of a downward move stands at approximately 56%, with a 34% chance of upward movement.
Drivers
- Return 24H: +0.33%
- EMA Slope: Negative at -0.0012, indicating slight bearish momentum
- Funding Z-Score: -0.41, suggesting slight negative funding pressure
- Basis Z-Score: -0.49, hinting at modest downside bias
- Order Book Imbalance (EMA5): -0.03, reflecting neutral order flow
- BTC Return 24H: +0.25%, contributing to overall market sentiment
Market volatility remains very low, and broader trend signals are relatively subdued, with a slight tilt toward downside based on current technical and on-chain metrics.
ETF Flows (BTC/ETH)
Recent ETF flow data shows mixed signals: Bitcoin ETFs have experienced a net outflow of approximately $205.5 million over the past day but have seen inflows over the past 5 days (+$233.7M). Ethereum ETFs, meanwhile, recorded a daily outflow of $51.5 million but experienced inflows over the 5- and 10-day periods. These flows suggest a cautious risk environment, with some investors rotating out of BTC in the short term, though longer-term flows remain positive. It’s important to note that ETF data for BTC and ETH is only contextual and not a direct primary signal for ADA’s immediate price action.
What to Watch Next
- Watch for a decisive break above $0.40 for potential bullish continuation.
- Monitor support levels around $0.385 for signs of potential downside acceleration.
- Observe broader market sentiment, especially in BTC and ETH ETF flows, for risk-on/off cues.
- Keep an eye on on-chain metrics and macro factors that could influence ADA’s technical outlook.
Hashtags: #Crypto #ADA #Cardano #MarketAnalysis #Cryptocurrency #Trading #BTC #ETH #ETFFlows #TechnicalAnalysis #MarketSentiment #Investing