Market Snapshot
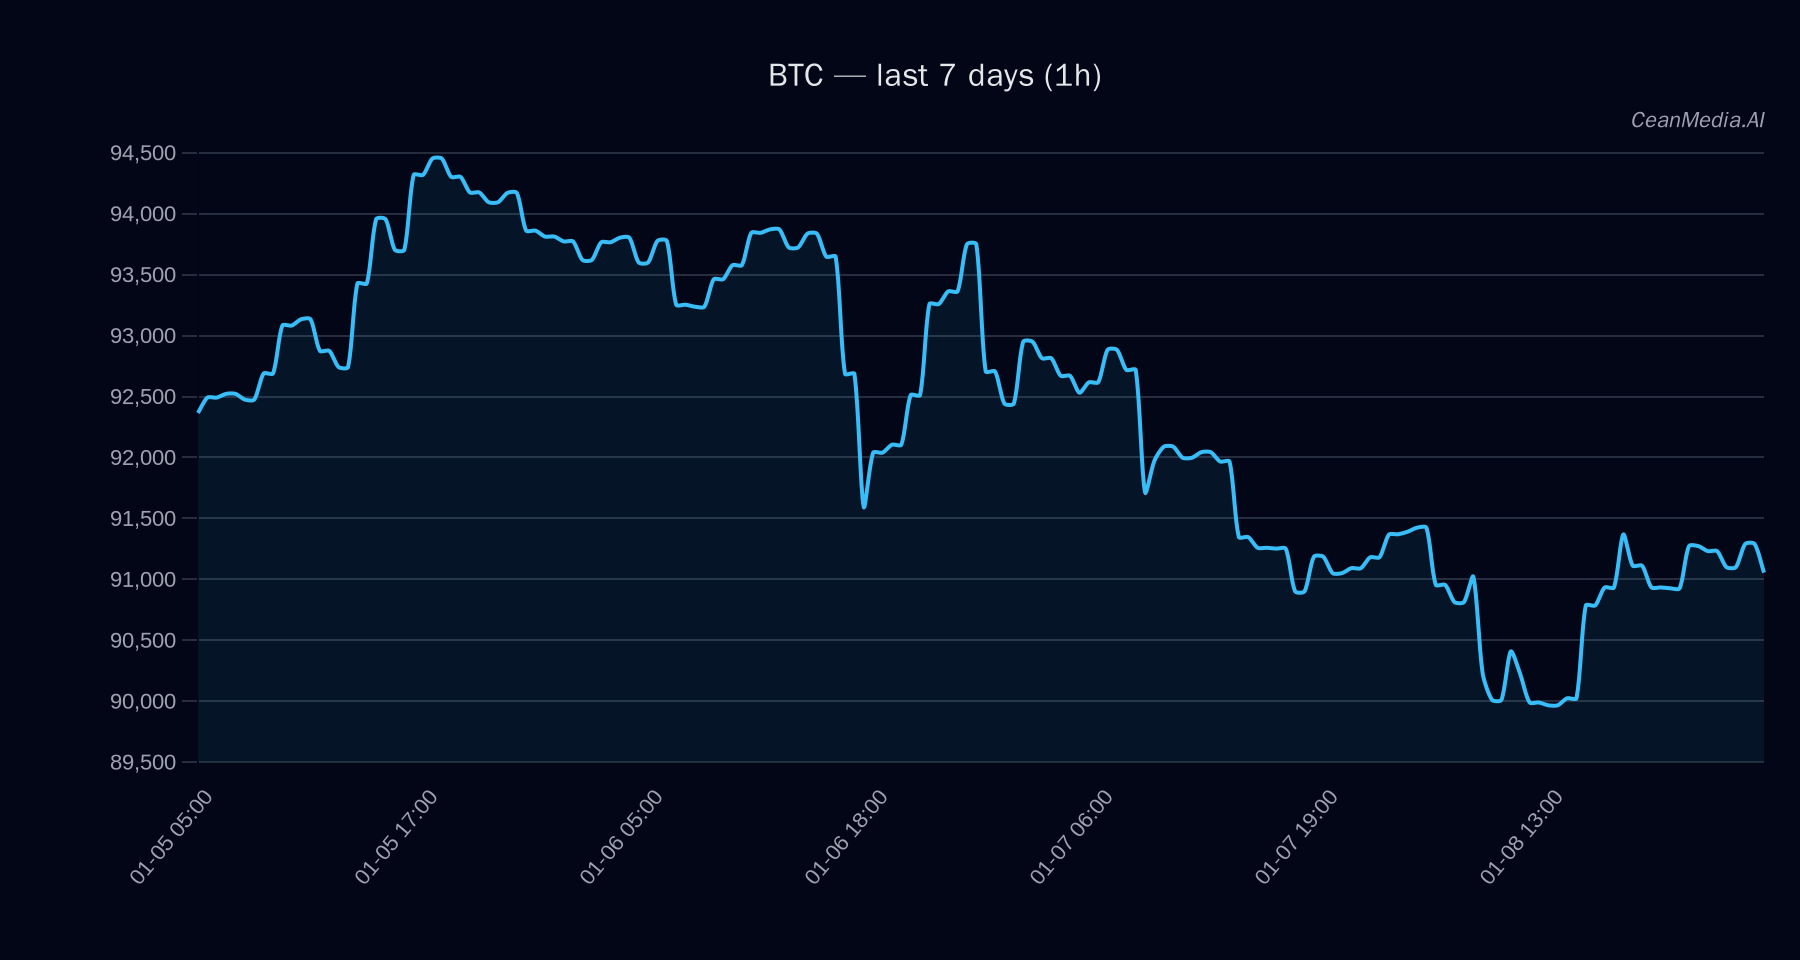
As of January 9, 2026, Bitcoin (BTC) trades around $91,256 with a sideways bias. The current technical environment indicates low volatility and a neutral momentum, with the price oscillating between key support at approximately $89,425 and resistance at around $93,075. Recent ETF flows show mixed signals for BTC and ETH, with BTC experiencing outflows over the past day but inflows over the last five days, suggesting cautious risk sentiment.
Technical Analysis: BTC
- Price Level: $91,255.99
- Support Levels: Major at $87,325; Near at $89,425
- Resistance Levels: Major at $92,700; Near at $93,075
- Breakout Targets: > $93,075 targets ~$94,943–$96,804; < $89,425 targets ~$87,642–$85,854
- Bias: Sideways with a slight upward tilt, supported by EMA12
SMA200 - Indicators: RSI at 53 indicating neutrality; very low volatility regime; EMA slope near zero
- Invalidation: Break below $89,425 or above $93,075 to confirm directional moves
Drivers
- Top Factors:
- 24H Return: Slight negative at -0.004
- EMA Slope: Near zero at 0.0001, indicating minimal trend
- Funding Z-Score: -1.89, reflecting modest funding pressure
- Order Book Imbalance: Slightly negative at -0.0054, suggesting balanced order flow
- Trend Strength: Low at 0.27, confirming sideways movement
- Market Momentum & Volatility: Very low, with a breadth of only 17% and a correlation coefficient of 1.00 over 72h, indicating a stable but cautious environment.
ETF Flows (BTC/ETH)
Recent ETF data shows a divergence between BTC and ETH flows. BTC ETFs experienced a significant outflow of $486.1M over one day but saw inflows of $91.1M over the last five days, suggesting a cautious risk-on/off environment. Conversely, ETH ETFs experienced consistent inflows, with $285.3M over five days and $152.9M over ten days. These flows indicate a nuanced risk sentiment, with traders possibly rotating assets within the crypto space. It is important to note that ETF flows are only available for BTC and ETH and should be considered as contextual rather than primary signals for BTC price direction.
What to Watch Next
- Monitor breakouts above $93,075 or below $89,425 for potential directional moves.
- Keep an eye on ETF flow trends, especially ETH inflows, for signs of risk appetite shifts.
- Observe RSI and volatility metrics for early signals of trend acceleration or reversal.
- Assess macroeconomic developments and market sentiment for broader context.
Hashtags: #Bitcoin #CryptoAnalysis #BTC #MarketUpdate #ETFFlows #TechnicalAnalysis #CryptoTrends #RiskOn #MarketSentiment #TradingSignals #CryptoNews