Market Snapshot
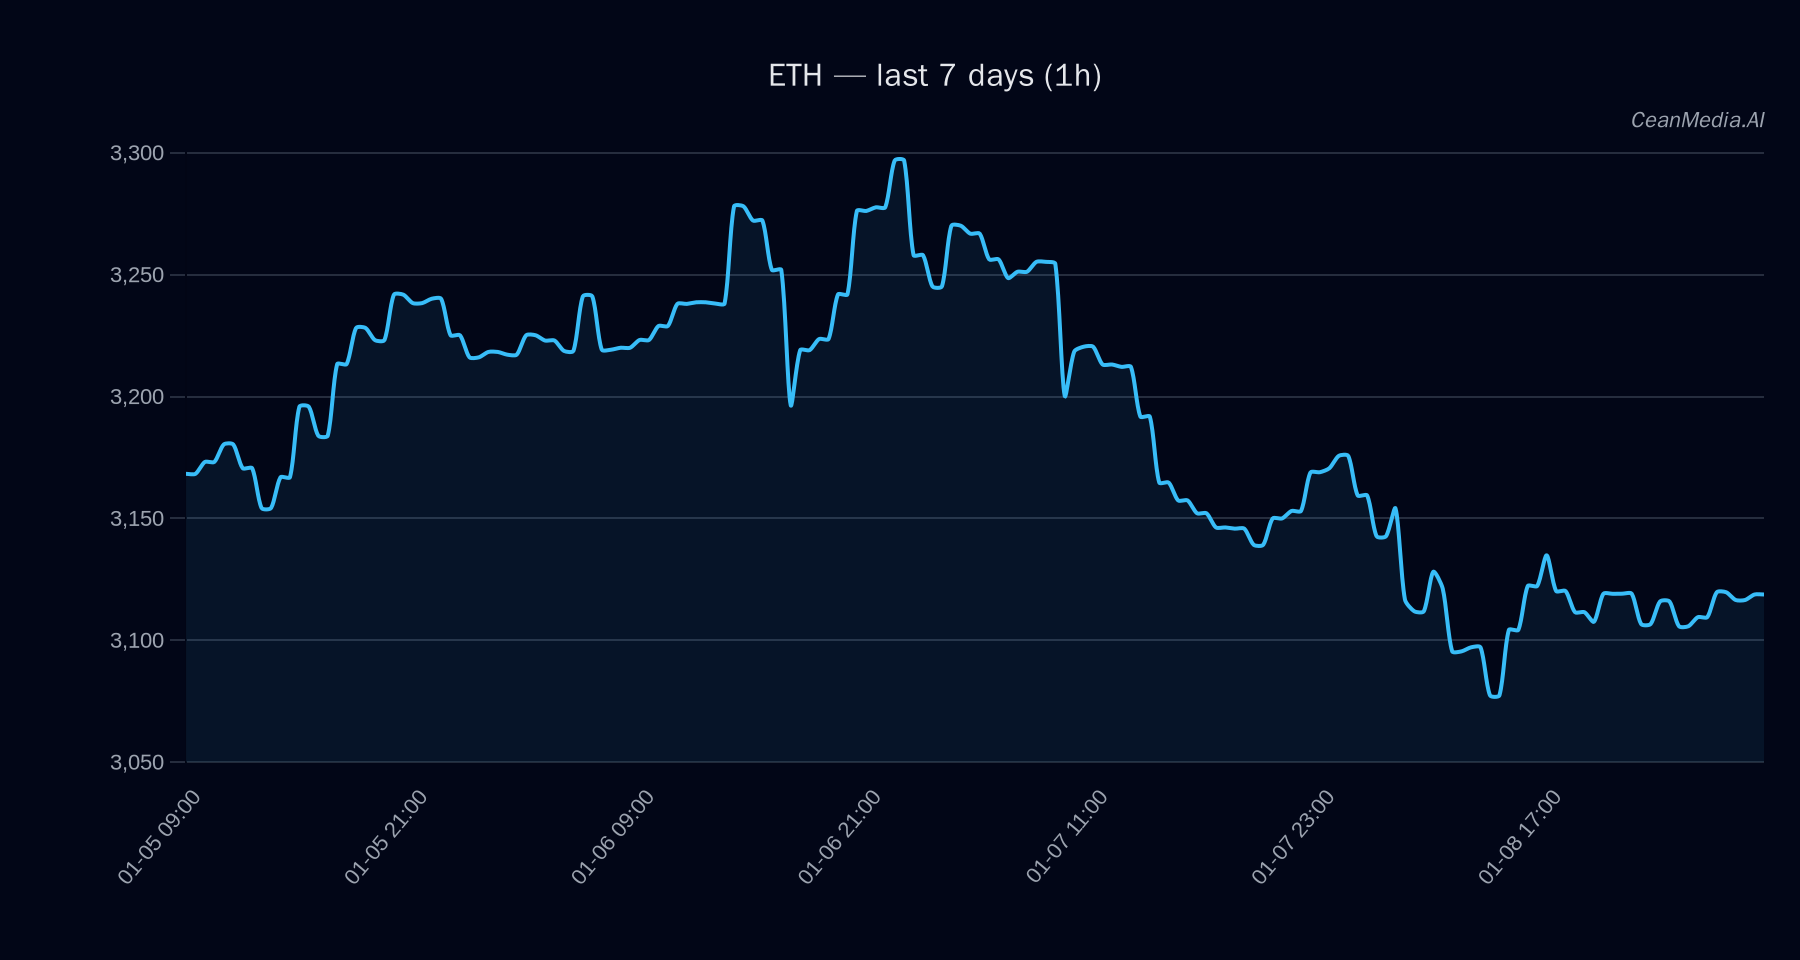
As of January 9, 2026, Ethereum (ETH) is trading around $3,124.19. The current market environment exhibits very low volatility with a neutral RSI at 49, and technical indicators suggest a sideways bias. ETF flows show mixed signals in the broader crypto market, with notable outflows in Bitcoin and inflows in ETH over recent days, indicating a nuanced risk sentiment.
Technical Analysis: ETH
- Key Levels: Support at approximately $3,062; resistance near $3,186. Break above resistance could target $3,250–$3,314, while a breakdown below support may lead to $3,000–$2,939.
- Bias: Slightly bearish with a 48% probability of downside in the short term; technical signals point to sideways movement due to EMA12 being below EMA26, and the SMA50 above SMA200, with RSI neutral at 49.
- Triggers: A close above $3,186 on a 1-hour chart could accelerate upward movement towards $3,250–$3,314. Conversely, a close below $3,062 may reinforce a downward move toward $3,000–$2,939.
- Invalidation: Break below $3,062 invalidates the sideways bias, increasing the likelihood of further declines.
Drivers
- Top Factors: Return over 24 hours remains nearly flat at -0.01, with a very slight positive trend in BTC (0.0008). The EMA slope is minimal at 0.0002, indicating limited momentum.
- Volatility & Sentiment: Market volatility remains very low, with fear index at 27, suggesting cautious sentiment. Funding and basis Z-scores are modest, reflecting balanced funding conditions.
- Market Dynamics: ETH’s trend strength is moderate, and order book imbalance favors slight selling pressure. The broader Bitcoin dominance continues to decline marginally, indicating some rotation into altcoins like ETH.
ETF Flows (BTC/ETH)
Recent ETF flow data shows that Bitcoin ETFs experienced a notable outflow of approximately $205.5 million in one day, but over the 5-day period, there has been a net inflow of $233.7 million. Ethereum ETFs, on the other hand, showed an immediate outflow of $51.5 million but maintained a positive net flow of $305.8 million over five days. These flows suggest a slight risk-on tilt toward ETH, although the overall ETF activity remains mixed and should be interpreted as supplementary context rather than a primary trading signal.
What to Watch Next
- Monitor if ETH can break above the $3,186 resistance to confirm short-term bullish momentum.
- Watch for a sustained move below $3,062, which could lead to further declines towards $3,000.
- Keep an eye on ETF flow trends, particularly any shifts in Bitcoin outflows or ETH inflows, as potential market sentiment indicators.
- Observe broader market volatility and macro factors that could influence ETH’s technical levels and investor risk appetite.
Hashtags: #Ethereum #CryptoAnalysis #ETH #MarketUpdate #ETFFlows #TechnicalAnalysis #CryptoTrends #DigitalAssets #Blockchain #Investing #MarketSentiment #CryptoNews