Market Snapshot
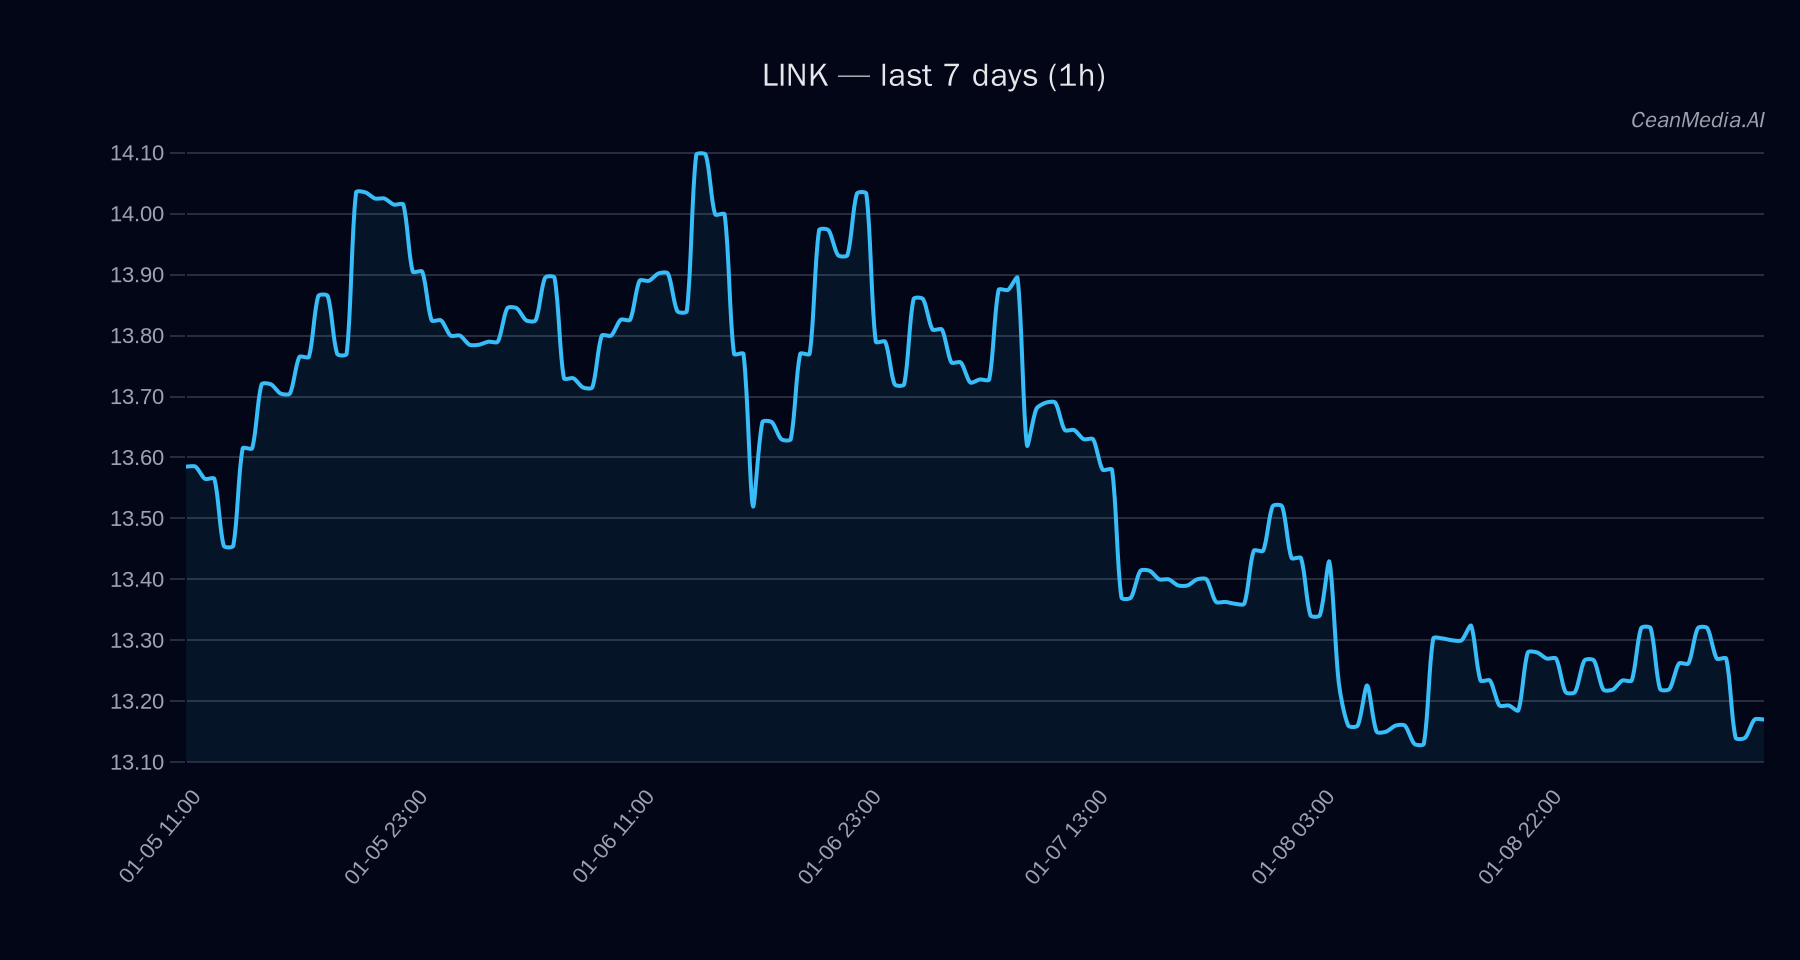
As of January 9, 2026, the price of LINK stands at approximately $13.17. The current market environment exhibits very low volatility with a broad sideways trend. Broader crypto market sentiment shows a cautious stance with Fear index at 27, and Bitcoin dominance slightly decreasing to 56.8%. ETF flows for Bitcoin and Ethereum indicate mixed investor sentiment, with recent outflows in Bitcoin ETFs and inflows in Ethereum ETFs over the past 5 days, suggesting a nuanced risk-on/off dynamic.
Technical Analysis: LINK
- Levels: LINK trades between a support zone at approximately $12.9 and resistance at about $13.4. A bullish breakout above $13.4 could target levels near $13.97, while a breakdown below $12.9 might see prices dip toward $12.39.
- Bias: The current technical bias is sideways with a slight downward tilt, supported by EMA12 being below EMA26, SMA50 above SMA200, and RSI at 43, indicating neutral momentum.
- Triggers: A close above $13.4 on a 1-hour timeframe would signal potential upward movement toward $13.97. Conversely, a close below $12.9 could accelerate a decline toward $12.39.
- Invalidation: The downside would be invalidated if LINK closes consistently above $13.4, invalidating the bearish outlook.
Drivers
- Top Factors: The primary drivers include minimal 24-hour return (0.0008), negative EMA slope (-0.0009), and low order-book imbalance (-0.05). Bitcoin’s modest positive return (0.0037) and stable trend strength (0.22) also influence sentiment.
- Momentum/Volatility: The market exhibits very low volatility (σ24h 0.53%) and subdued momentum, with no significant directional pressure from Bitcoin or altcoins, supporting the sideways trend in LINK.
ETF Flows (BTC/ETH)
Recent ETF activity shows Bitcoin ETFs experiencing a net outflow of approximately $205.5 million in one day but a total inflow of $233.7 million over five days, indicating cautious risk-off sentiment with short-term declines offset by longer-term interest. Ethereum ETFs show a different pattern, with a one-day outflow of $51.5 million but inflows totaling $305.8 million over five days, suggesting a shift toward risk-on positioning in ETH. These flows provide context but should not be solely relied upon for LINK’s directional bias.
What to Watch Next
- Monitor LINK’s close above or below key levels ($13.4 resistance, $12.9 support) for potential trend shifts.
- Observe broader market sentiment and ETF flows for clues on risk appetite, especially ETH inflow signals.
- Keep an eye on macro factors such as volatility regimes and Bitcoin dominance for potential impacts on LINK’s price action.
- Watch for any technical breakouts or breakdowns that could accelerate directional moves.
Hashtags: #Crypto #LINK #Bitcoin #Ethereum #MarketAnalysis #Trading #Altcoins #CryptoTrends #ETFFlows #TechnicalAnalysis #CryptoNews