Market Snapshot
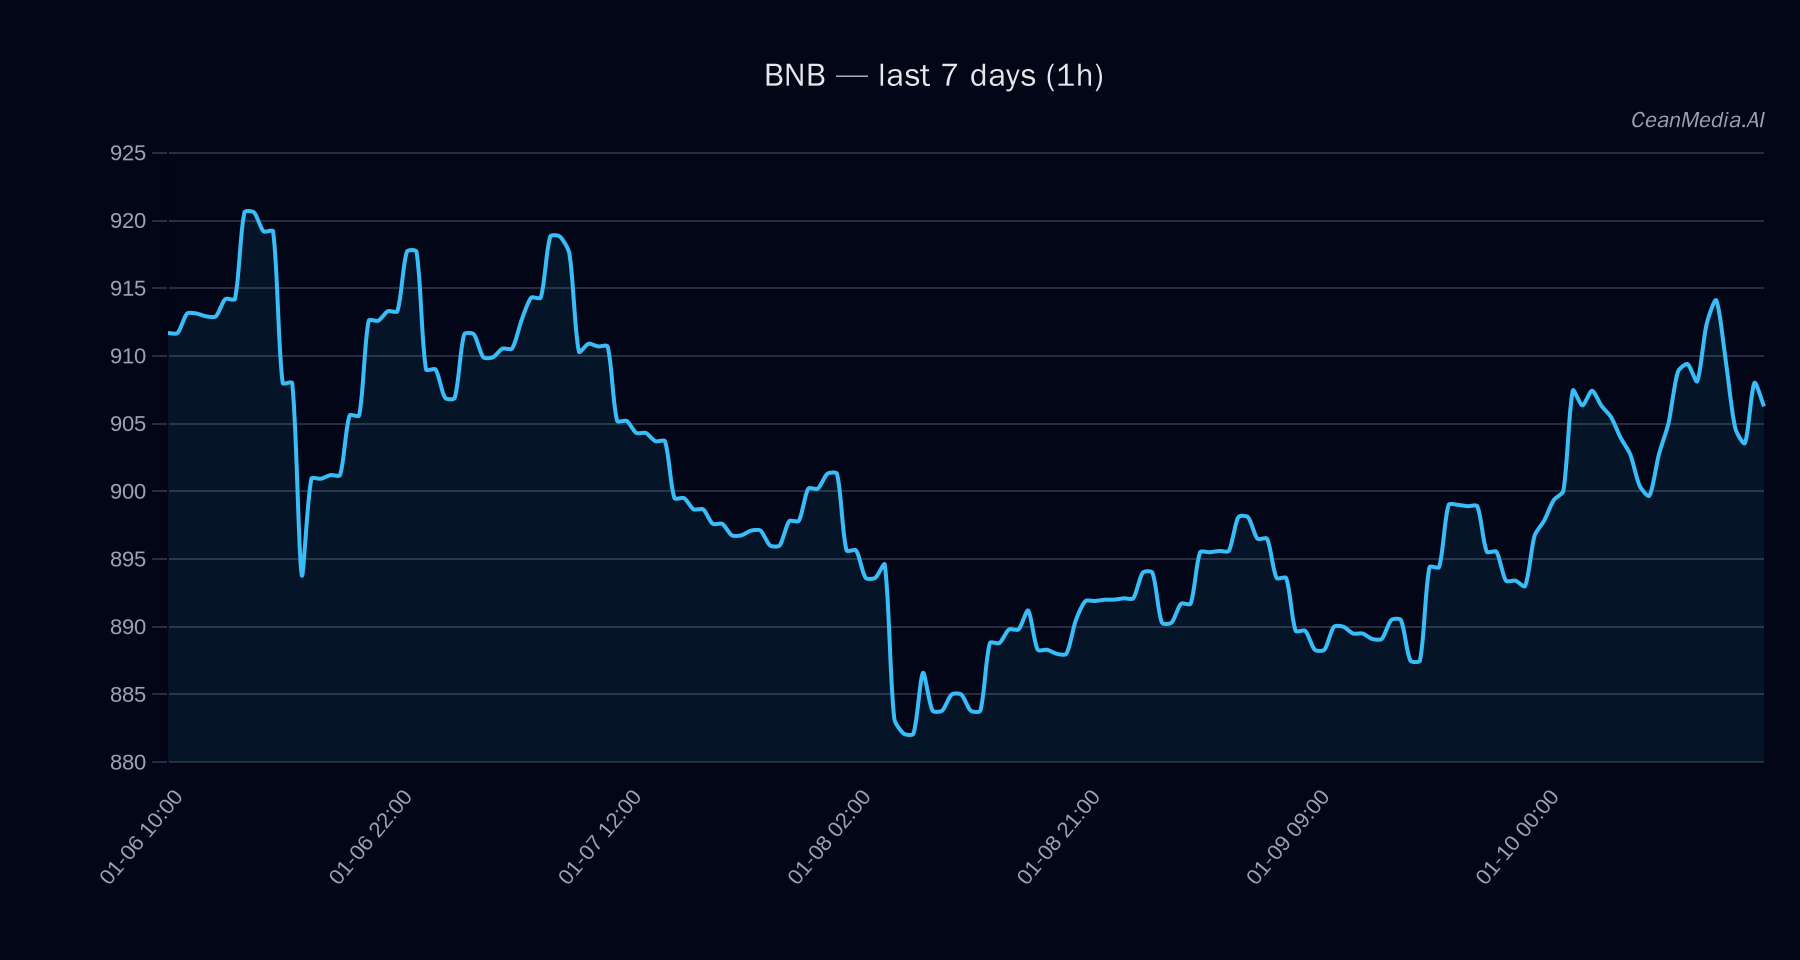
On January 11, 2026, BNB is trading around 909.66, with a short-term bullish bias indicated by technical signals. The broader market context shows low volatility and subdued trading activity, with ETF flows predominantly favoring Bitcoin over the past week, while Ethereum flows have been positive over longer periods.
Technical Analysis: BNB
- Key Levels: Support at 891 (near), major support at 866; Resistance at 908 (major), near resistance at 928.
- Bias & Signals: Bullish trend indicated by EMA12 > EMA26, SMA50 > SMA200, RSI at 58. Low volatility regime (σ24h 0.31%).
- Forecast & Triggers: 53% probability of upward movement; if the 1-hour close surpasses 928, potential move to 946–964 range. Conversely, a close below 891 could lead to declines to 855–873.
- Invalidation: Break below 891 invalidates bullish outlook, while break above 928 confirms upside potential.
Drivers
- Top factors include a modest 0.94% return in 24H, slight negative EMA slope, and a funding Z-score of 1.33 indicating moderate funding pressure.
- Order book imbalance is slightly negative, and Bitcoin’s minimal 0.04% return and trend strength suggest limited market momentum.
- Volatility remains very low, reflecting cautious trading sentiment, while the breadth indicator sits at 33%, indicating limited market participation.
ETF Flows (BTC/ETH)
Recent ETF flow data shows Bitcoin ETFs gaining +$2.0M over the past day but experiencing significant outflows over 5 and 10 days. Ethereum ETFs, on the other hand, have seen a recent outflow of -$10M in 1 day but positive inflows over 5 and 10 days, totaling +$132M. These flows suggest a cautious risk-on/off sentiment, with Bitcoin experiencing short-term profit-taking and Ethereum attracting longer-term interest. It is important to note that these ETF flows are only for BTC and ETH and serve as contextual market signals rather than direct indicators for BNB.
What to Watch Next
- Monitor BNB’s response around the 891 support and 928 resistance levels for potential breakout signals.
- Observe broader market volatility and ETF flow trends for clues on overall risk appetite.
- Keep an eye on Bitcoin’s ETF inflows and outflows as a gauge of institutional risk sentiment.
- Watch for any shifts in technical momentum, especially EMA slopes and RSI movements, for early signs of trend change.
Hashtags: #BNB #CryptoAnalysis #MarketUpdate #TechnicalAnalysis #ETFFlows #Bitcoin #Ethereum #Altcoins #CryptoTrends #TradingSignals #MarketSentiment