Market Snapshot
As of January 11, 2026, LINK is trading around $13.18 with a neutral short-term bias. The broader market environment shows very low volatility, with ETF flows indicating risk-off sentiment in Bitcoin and a slight risk-on tilt in Ethereum. Market breadth remains subdued, and overall momentum appears cautious.
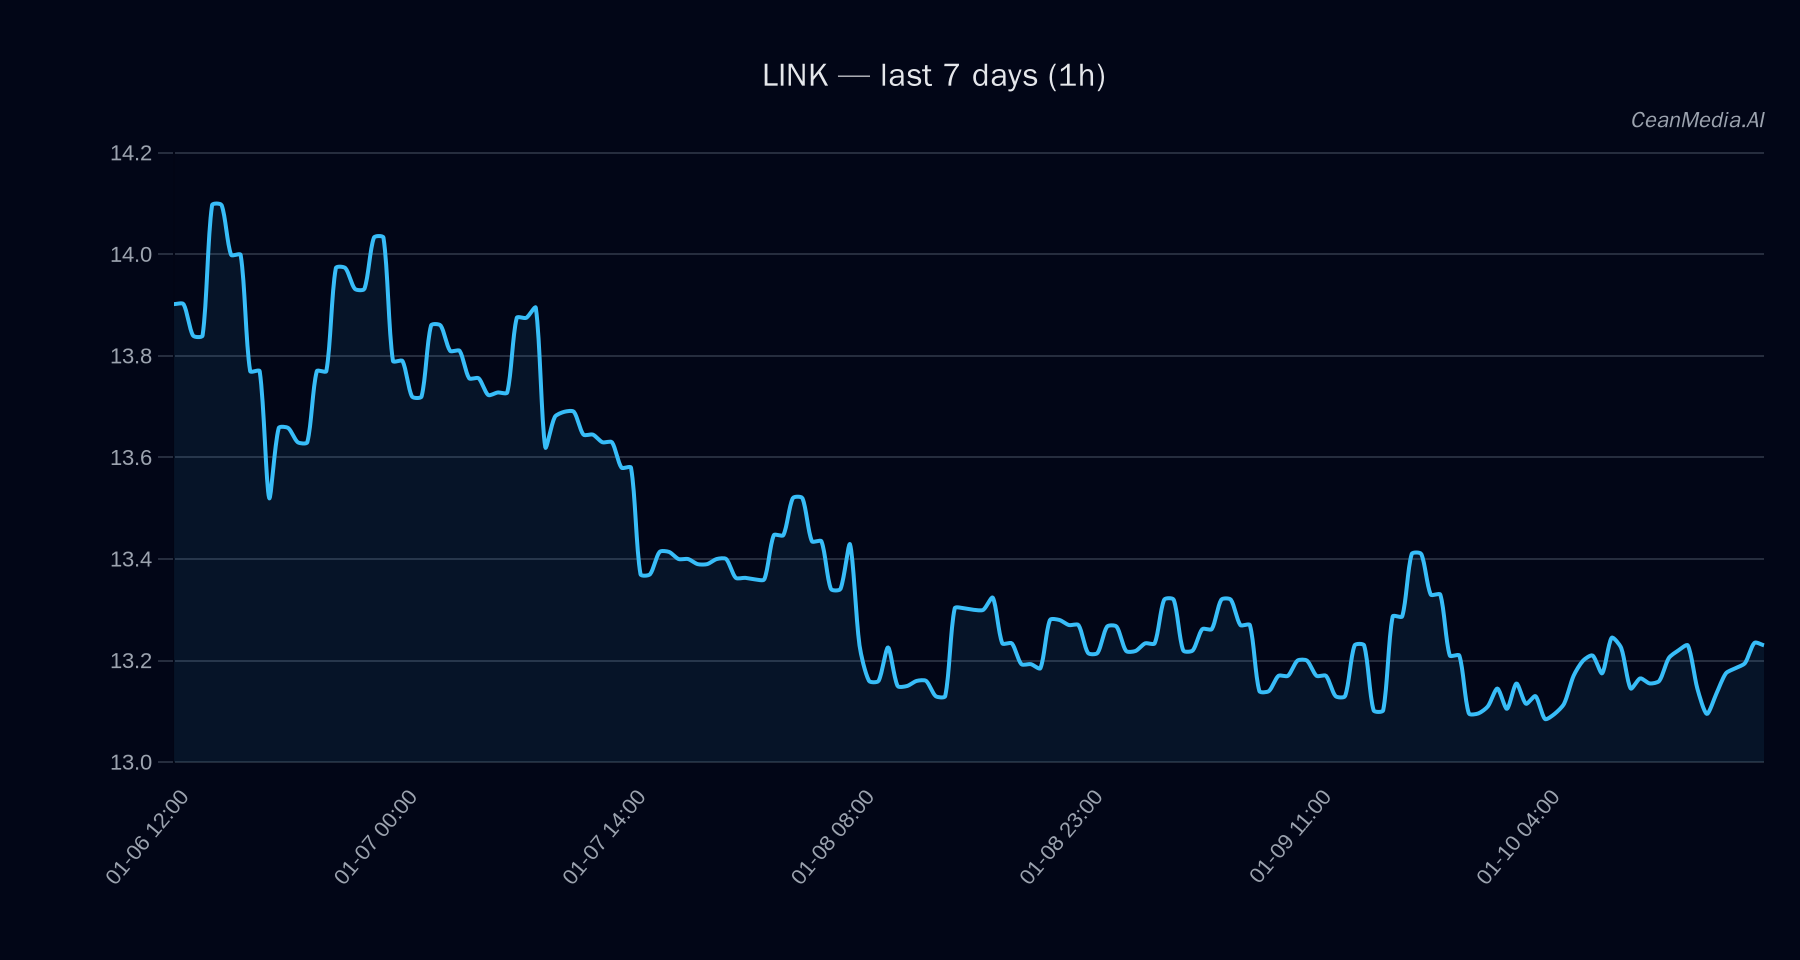
Technical Analysis: LINK
LINK is currently positioned between key support at $12.9 and resistance at $13.4. A break above $13.4 could target the $13.71–$13.98 range, while a decline below $12.9 might see prices test the $12.66–$12.40 zone. The technical indicators suggest a bearish bias, with EMA12 below EMA26 and SMA50 below SMA200, confirming a downward trend. The RSI is neutral at 50, reflecting indecision in the short term. The current volatility regime is very low, supporting a cautious outlook. The probability of a downward move over the next 24 hours is approximately 51%, slightly higher than the upside scenario.
Drivers
- Return 24H: +0.01%
- EMA Slope: 0.0006, indicating very mild upward momentum in short-term trend
- Funding Z-Score: 0.47, suggesting a neutral funding environment
- Basis Z-Score: 1.06, indicating slight positive basis pressure
- Order Book Imbalance (EMA5): -0.04, pointing to slight selling pressure
- BTC Return 24H: +0.0037%, which supports a stable Bitcoin backdrop but with limited influence on LINK
- Market Volatility Regime: Very low, emphasizing cautious trading conditions
- Trend Strength: 0.81 in Bitcoin, indicating moderate positive momentum but not directly translating into LINK’s immediate trend
ETF Flows (BTC/ETH)
Recent ETF data shows Bitcoin ETFs experiencing outflows of approximately $250 million daily, with cumulative withdrawals over five and ten days reaching nearly $681 million and $720 million respectively. Conversely, Ethereum ETFs are experiencing modest inflows, with $93.8 million outflow on the daily basis but positive flows over 10 days totaling $48.2 million. These flows reflect a cautious risk sentiment with a tilt towards Ethereum, although this data is only relevant to BTC and ETH markets and should not be seen as primary signals for LINK.
What to Watch Next
- Monitor whether LINK can break above the resistance at $13.4 for a potential rally toward $13.71–$13.98.
- Watch for a decline below support at $12.9, which could lead to further downside testing around $12.66–$12.40.
- Keep an eye on Bitcoin ETF outflows as an indicator of broader risk sentiment shifts, though it remains a secondary factor for LINK.
- Observe overall market volatility and breadth for signs of increased trading activity or trend reversals.
Note: ETF flow data is only available for BTC and ETH and serves as contextual information rather than a primary driver for LINK’s price action.
Hashtags: #CryptoAnalysis #LINK #TechnicalAnalysis #MarketUpdate #CryptoTrends #Bitcoin #Ethereum #ETFFlows #RiskOff #MarketSentiment #CryptoForecast