Market Snapshot
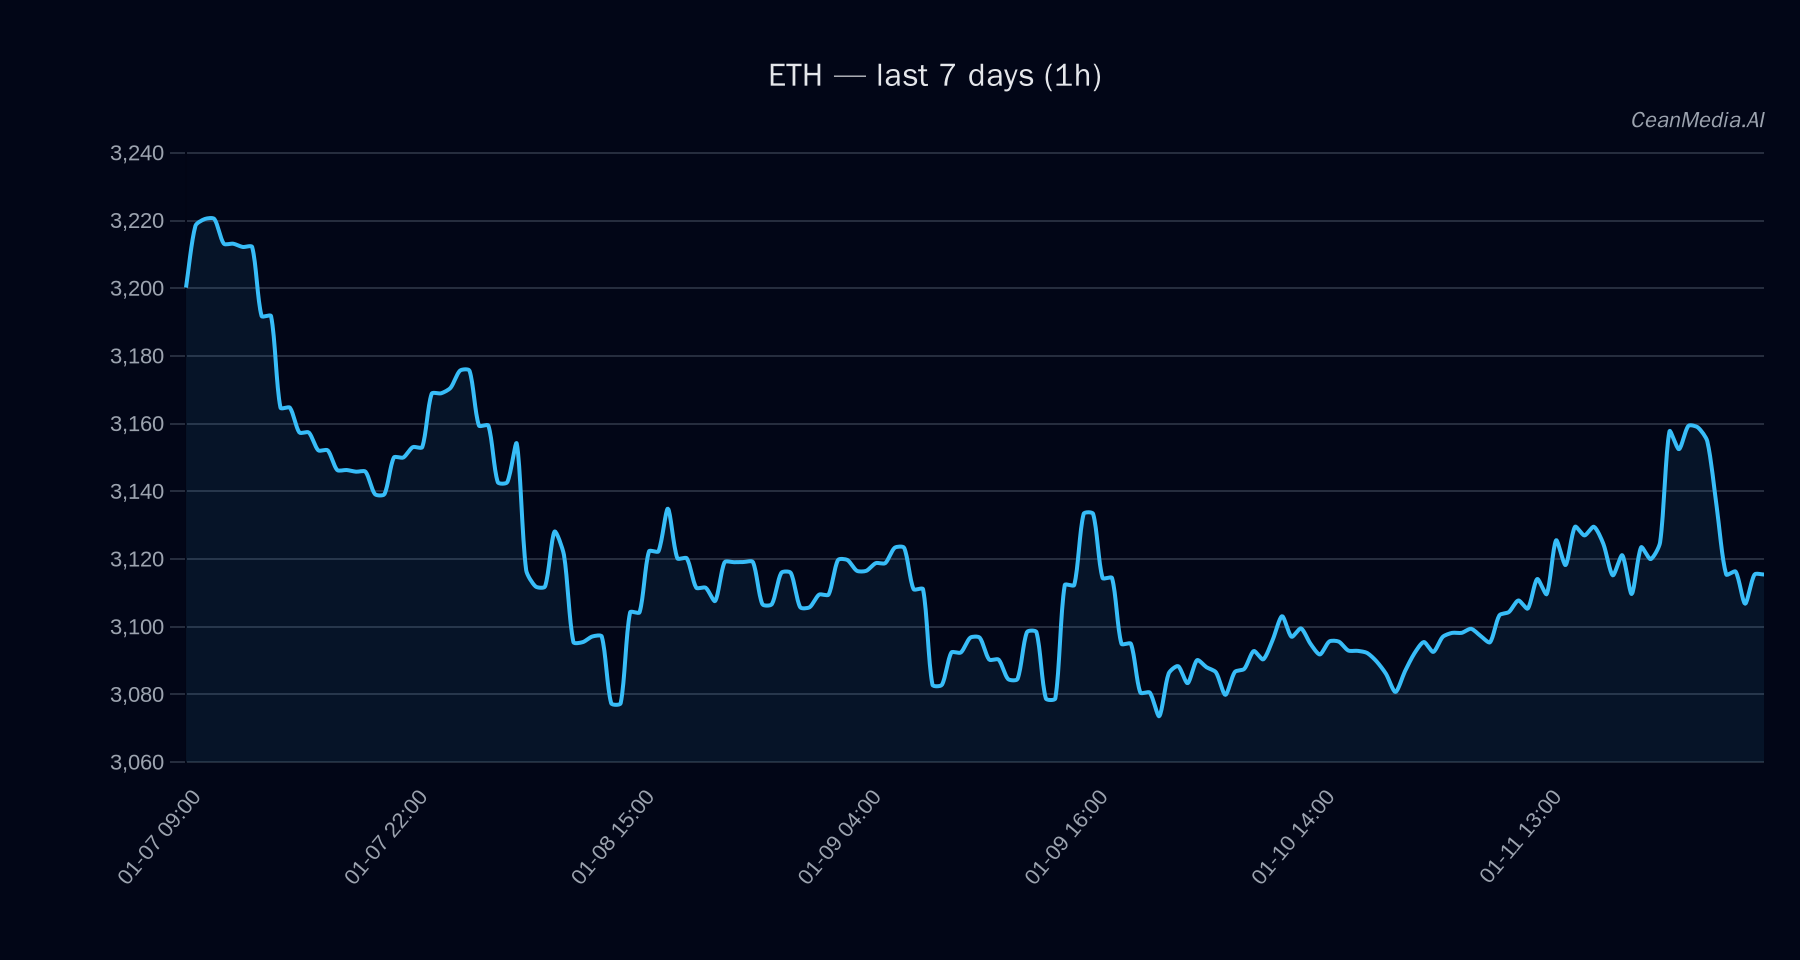
As of January 12, 2026, ETH is trading around $3,119, with a neutral to slightly bearish short-term outlook. The broader market continues to show low volatility, with very subdued trading activity and minimal directional momentum. ETH’s market dynamics are influenced by recent ETF flow patterns and macro factors, though these are secondary to technical signals for now.
Technical Analysis: ETH
- Levels: Support is identified near $3,058 (major support) and $3,042 (P20). Resistance is around $3,182 (near-term) and $3,214 (major). A break above resistance could target $3,245 to $3,309, while a decline below support may see ETH fall toward $2,935 to $2,995.
- Bias: The current technical setup indicates a sideways to slightly bearish bias, with EMA12 above EMA26, but the SMA50 below SMA200, and RSI at 48, signaling neutrality.
- Triggers: A decisive close above $3,182 could accelerate upward movement, while a close below $3,058 may confirm further downside.
- Invalidation: A sustained move below $3,058 would invalidate any bullish short-term signals and suggest potential further declines.
Drivers
- Recent 24-hour return is marginal at +0.32%, indicating limited momentum.
- The EMA slope is slightly negative, reflecting a modest downward trend.
- Funding and basis Z-scores are negative, suggesting a cautious market with slight bearish bias.
- Market volatility remains very low, with sigma at 0.37%, and the overall trend strength is modest.
- Market breadth remains subdued at 33%, with a high BTC dominance of 56.9%, decreasing slightly over the past week.
ETF Flows (BTC/ETH)
Current ETF flow data shows persistent outflows in Bitcoin ETFs, with a 1-day decline of $250 million, and a 5-day total of nearly $681 million. Conversely, ETH ETFs have experienced a smaller outflow of approximately $94 million in the past day, but a positive inflow of $48 million over 10 days. These flows suggest a risk-off environment for Bitcoin, while ETH shows some resilience, although overall ETF activity remains a secondary context for ETH’s immediate price action.
What to Watch Next
- Monitor whether ETH can sustain a close above $3,182 to confirm upward momentum.
- Watch for a break below $3,058 to validate potential further declines toward $2,935.
- Keep an eye on macro market signals and ETF flow trends for broader risk sentiment shifts.
- Observe volatility levels and market breadth for signs of increasing trading activity or directional bias.
Note: ETF flows are only provided for BTC and ETH and serve as contextual indicators rather than primary trading signals for ETH.
Hashtags: #Ethereum #CryptoAnalysis #MarketUpdate #TechnicalAnalysis #CryptoTrends #Investing #CryptoNews #BTC #ETFs #MarketSentiment #CryptoSignals #Trading