Market Snapshot
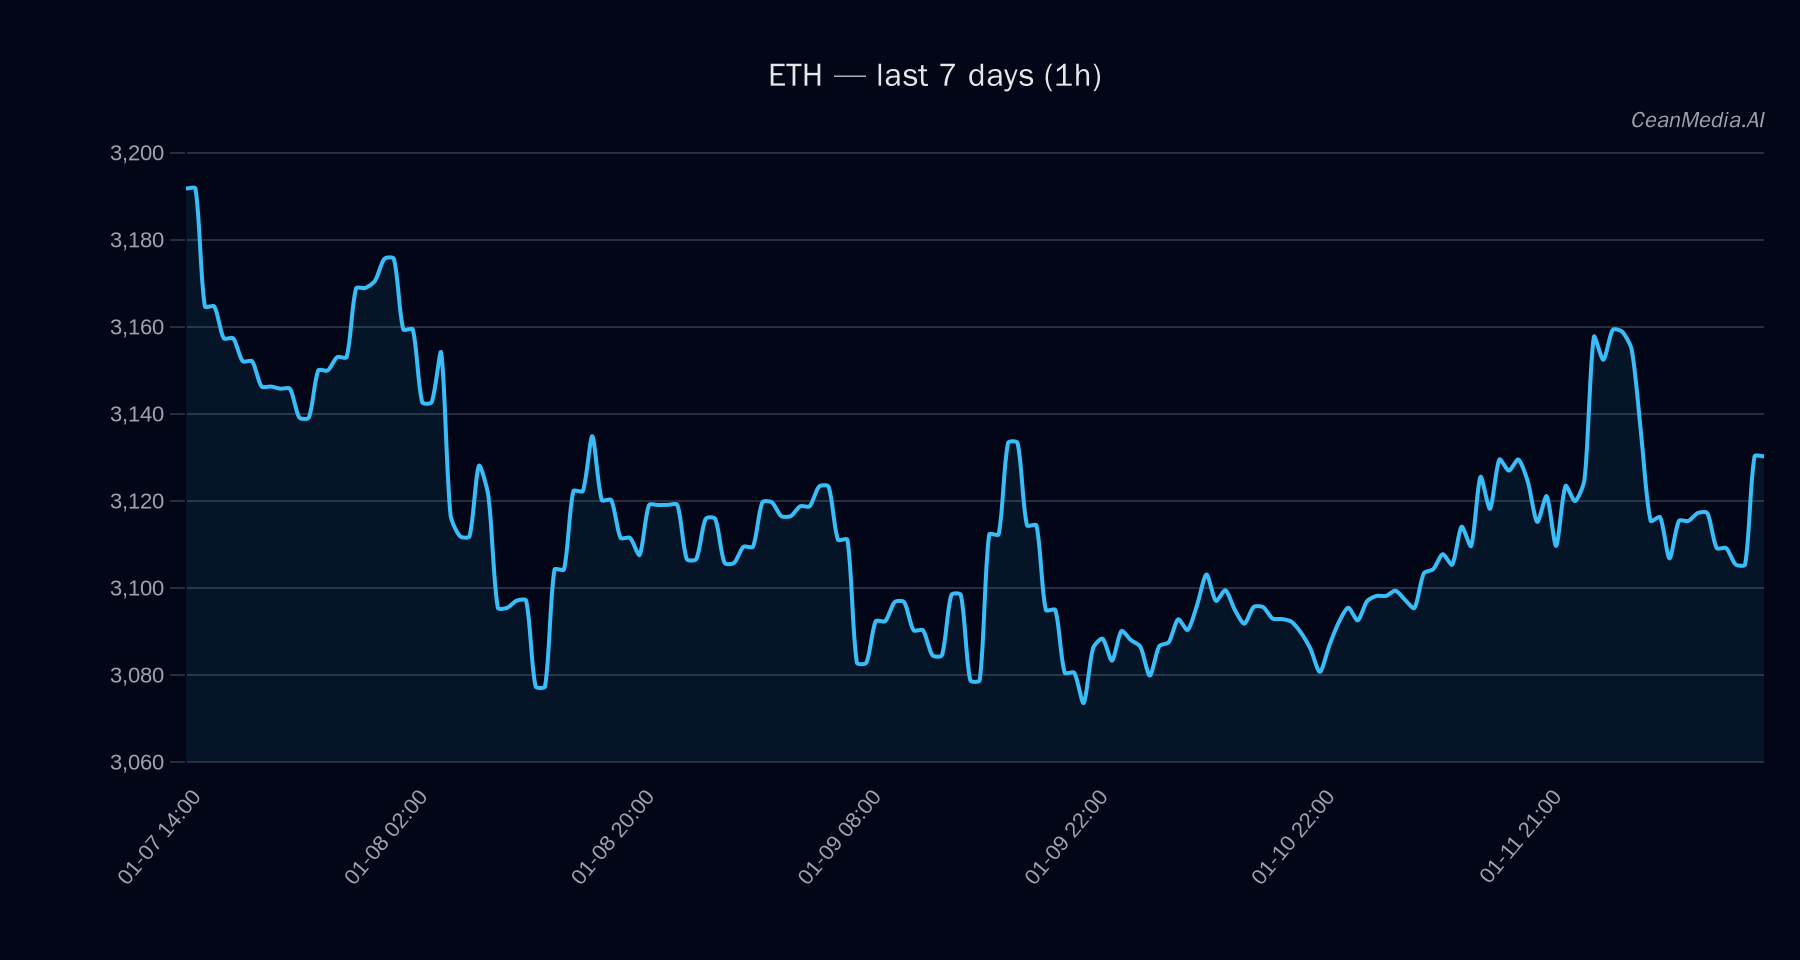
As of January 12, 2026, Ethereum (ETH) is trading around the $3,127 level with a cautious outlook. The broader market sentiment remains subdued with very low volatility and a slight bearish tilt. ETF flows indicate a mixed picture, particularly in the context of Bitcoin and Ethereum ETF activity, which can influence risk appetite but are not primary signals for ETH’s price movement.
Technical Analysis: ETH
- Key Levels: Support at approximately $3,064 (major support), Resistance near $3,190 (major resistance). Break above $3,190 targets $3,253 to $3,317; break below $3,064 targets $3,003 to $2,942.
- Bias: Bearish with a short-term forecast leaning sideways or down, with a 47% probability for downside movement.
- Triggers: A daily close above $3,190 could signal a move towards $3,253–$3,317, while a close below $3,064 may lead to further declines toward $3,003–$2,942.
- Invalidation: The bearish outlook remains valid unless ETH closes convincingly above $3,190, invalidating the downside bias.
Drivers
- Top Factors: Return over 24 hours is minimal at 0.39%, EMA slope remains positive at 0.0005, and basis Z-score is strong at 2.32, indicating some underlying strength.
- Market Momentum and Volatility: The market exhibits very low volatility (σ24h 0.38%) with a broad breadth of 83%, suggesting limited immediate directional movement. Funding Z-score remains neutral at -0.05, and ETF flow Z-score over 60 days is negative, indicating some outflows but not a decisive trend.
ETF Flows (BTC/ETH)
Current ETF activity shows significant outflows in Bitcoin ETFs over the past 5 and 10 days, while ETH ETFs have experienced modest outflows over 1 and 5 days but a slight inflow over 10 days. This indicates a cautious risk-on/off sentiment, with recent ETF activity suggesting some risk-off tendencies primarily in Bitcoin, while ETH’s flows are less definitive. It is important to note that these ETF flows are only relevant within the BTC/ETH context and should not be solely relied upon for ETH trading decisions.
What to Watch Next
- Monitor daily close levels around $3,064 and $3,190 for potential trend confirmation or invalidation.
- Watch for a breakout above $3,190 or below $3,064 to confirm short-term directional bias.
- Keep an eye on broader market volatility and ETF flow trends for signs of shifting risk appetite.
- Observe Bitcoin ETF flows as an indirect gauge of market sentiment, noting recent outflows in Bitcoin ETFs.
Hashtags: #Ethereum #CryptoAnalysis #MarketUpdate #CryptoTrends #ETH #Bitcoin #ETF #MarketSentiment #TechnicalAnalysis #CryptoNews #DigitalAssets #Investing