Market Snapshot
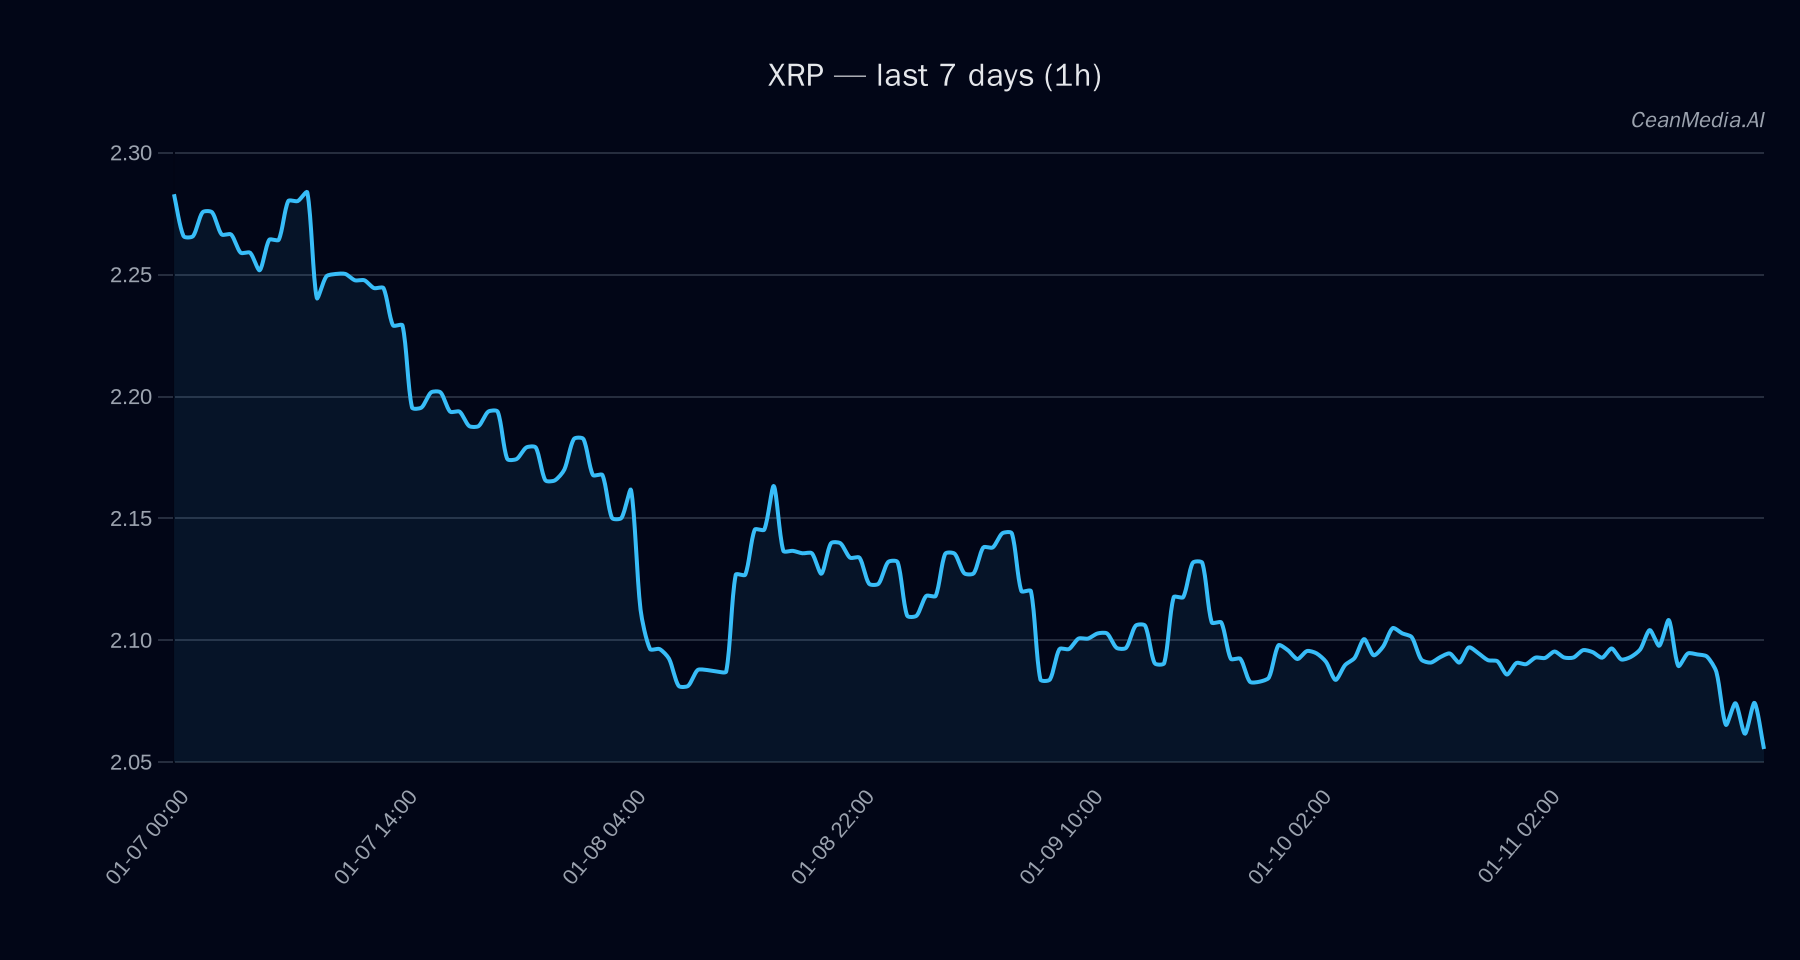
As of January 12, 2026, XRP is trading around the $2.06 level, with a near-term bias leaning towards a decline. The broader market environment shows low volatility and a cautious risk sentiment, evidenced by ETF flows and on-chain metrics. Bitcoin and Ethereum ETF flows indicate a risk-off stance, with significant outflows over the past week, although these are primarily peripheral signals relative to XRP.
Technical Analysis: XRP
The current price of XRP sits between key support at approximately $2.02 and resistance at around $2.10. A breakout above $2.10 could target levels near $2.14 to $2.18, while a decline below support at $2.02 might see the price testing lower support zones around $1.94 to $1.98.
- Levels: Support at 2.02, resistance at 2.10; breakout targets at 2.14–2.18, breakdown targets at 1.94–1.98.
- Bias: Bearish, with a 49% probability of downside movement.
- Triggers: Close above 2.10 for bullish continuation; close below 2.02 for bearish move.
- Invalidation: Break and close above 2.10 or below 2.02 to confirm directional bias.
The technical indicators support a bearish outlook, with EMA and SMA alignments signaling downside momentum, RSI at 36 indicating oversold conditions but still neutral for a reversal, and very low volatility regime suggesting subdued price action.
Drivers
- Top Factors: Slight negative return over 24 hours (-0.02), negative EMA slope, and funding Z-score indicating potential bearish sentiment.
- Momentum & Volatility: Trend strength remains moderate (0.78), with low volatility and limited order-book imbalance pointing to subdued market activity.
- Market Sentiment: Breadth remains relatively healthy at 67%, but fear index (F&G) at 27 suggests caution.
ETF Flows (BTC/ETH)
Current ETF flows reveal significant outflows for Bitcoin (-$250M daily, -$680.9M over 5 days), indicating a risk-off environment. Ethereum ETF outflows are smaller but also negative (-$93.8M daily). These flows suggest investors are reducing exposure to major cryptocurrencies, which may indirectly influence altcoin sentiment, including XRP, although they are not primary signals.
It’s important to note that ETF data pertains only to BTC and ETH and should be viewed as a broader market context rather than a direct indicator for XRP’s price movement.
What to Watch Next
- Monitor XRP’s price action around support at 2.02 and resistance at 2.10.
- Watch for a decisive close above 2.10 for potential bullish confirmation.
- Observe overall market risk sentiment and ETF flows for signs of broader risk-on or risk-off shifts.
- Keep an eye on on-chain metrics and volatility regimes for early warning signals.
Hashtags: #XRP #CryptoAnalysis #MarketUpdate #TechnicalAnalysis #Altcoins #CryptoTrends #RiskOff #ETFFlows #Bitcoin #Ethereum #CryptoSignals #TradingStrategy