Market Snapshot
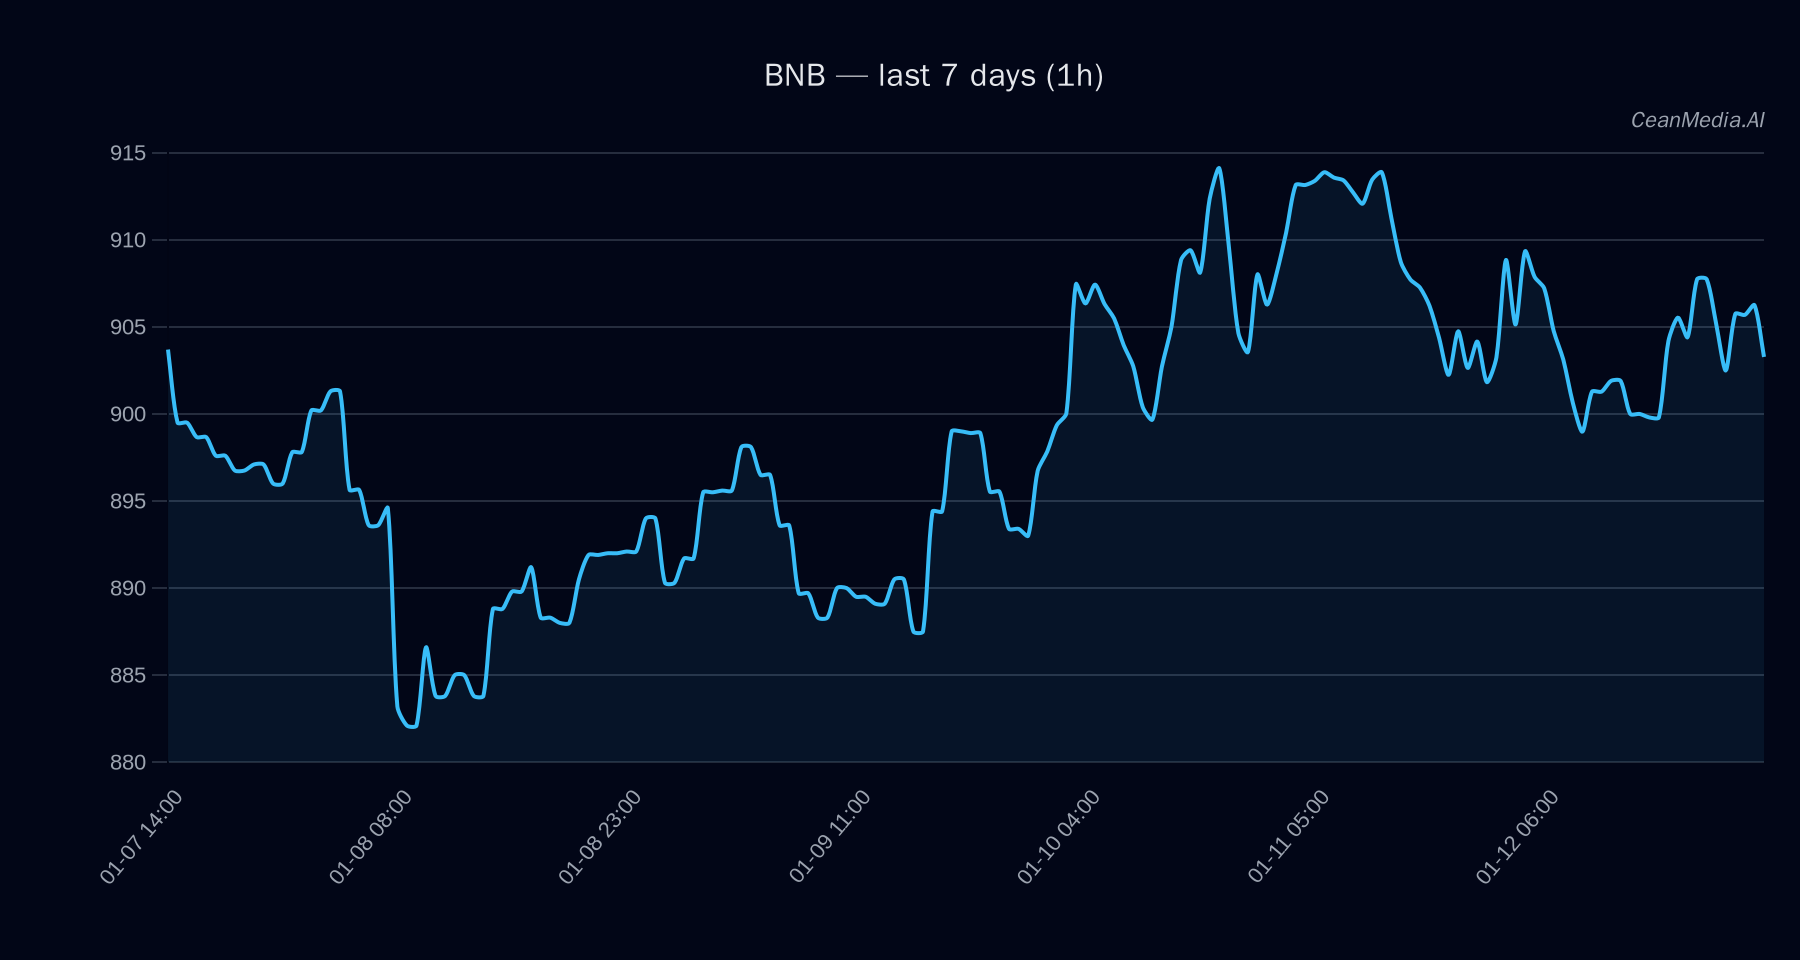
As of January 13, 2026, BNB is trading around $905.24 with a neutral short-term bias. The market exhibits very low volatility and a balanced risk profile, with the price confined between key support at $887 and resistance at $923. Recent ETF flows for Bitcoin and Ethereum show significant outflows, indicating a cautious risk environment, although this is only context for BNB and not a primary trading signal.
Technical Analysis: BNB
- Levels: Support major at $862, near support at $887; Resistance major at $909, near resistance at $923.
- Bias: Bullish short-term with a 51% probability of upward movement. The technical indicators suggest a bullish trend, supported by EMA and SMA alignments.
- Triggers: A daily close above $923 could target $941.81–$960.28; a close below $887 might lead to a decline towards $869.39–$851.65.
- Invalidation: Break below $887 invalidates the bullish scenario, increasing downside risks.
The current technical landscape indicates a cautious bullish outlook, with key levels to monitor for potential breakout or breakdown signals.
Drivers
- Top factors impacting BNB include a neutral 24-hour return (~0%), slight negative EMA slope (-0.0003), and modest funding and basis Z-scores (~0.5 and 0.38 respectively).
- Order-book imbalance remains minimal (EMA5: 0.0017), with Bitcoin’s 24-hour return slightly negative (-0.0025).
- Market momentum and volatility are very low, reflecting subdued trading activity and cautious investor sentiment.
- Bitcoin’s trend strength remains weak (0.12), and overall market breadth is above 50%, indicating some underlying support.
ETF Flows (BTC/ETH)
Recent ETF flows show significant outflows from Bitcoin (-$250M daily, -$680.9M over 5 days) and Ethereum (-$93.8M daily, slight inflow over 10 days). This suggests a risk-off sentiment prevailing in the broader crypto market. While these flows primarily pertain to BTC and ETH, they provide context for the overall risk environment, which may influence BNB’s short-term trajectory.
What to Watch Next
- Monitor daily close above $923 for potential bullish breakout targets.
- Watch for a decline below $887 to assess downside risks toward $851–$869.
- Keep an eye on Bitcoin and Ethereum ETF flows for signs of shifting risk appetite.
- Observe changes in volatility and market breadth for early indications of trend shifts.
Hashtags: #Binance #Cryptocurrency #TechnicalAnalysis #MarketUpdate #CryptoTrends #ETFFlows #BTC #ETH #Altcoins #Trading #Investing #CryptoAnalysis