Market Snapshot
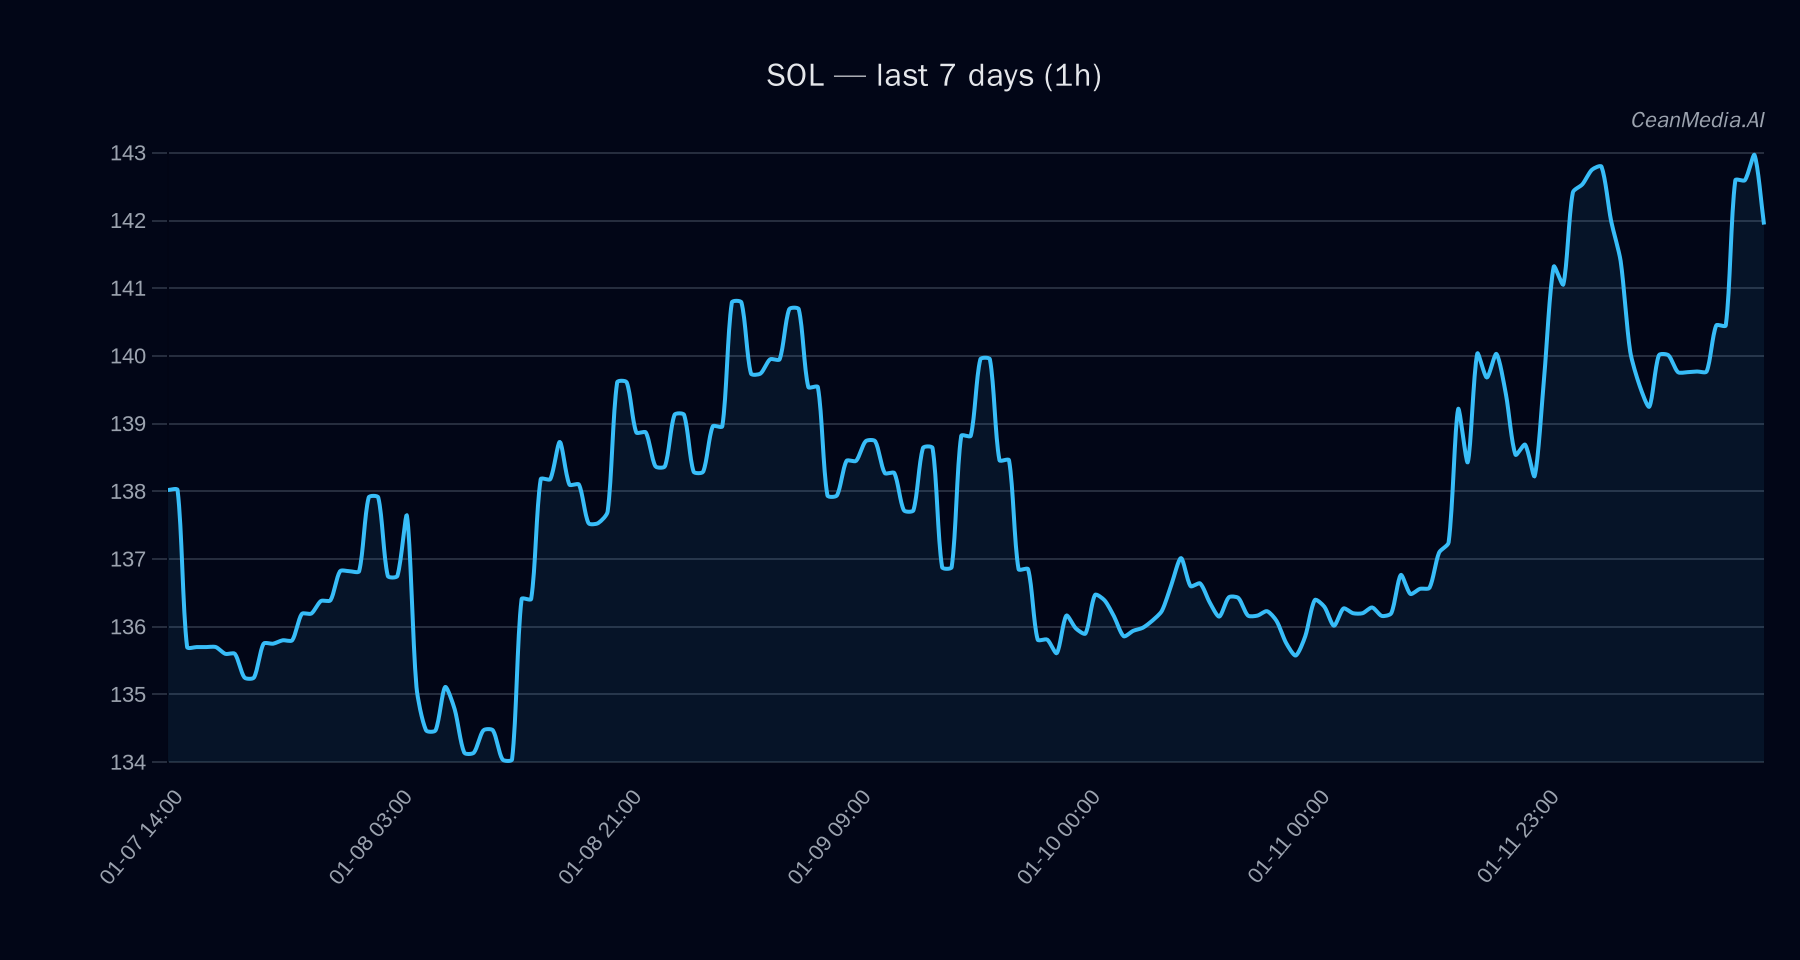
As of January 13, 2026, Solana (SOL) is trading near key support and resistance levels, with a current price of approximately $141.09. The broader market sentiment shows low volatility and a cautious risk environment, with ETF flows indicating ongoing risk-off sentiment in major cryptocurrencies like Bitcoin and Ethereum.
Technical Analysis: SOL
Solana’s technical indicators suggest a neutral to slightly bullish bias in the short term. The key levels to watch are:
- Support: Major at $130, Near at $138
- Resistance: Major at $139, Near at $144
The current price sits between the support and resistance zones. A breakout above $144 could push SOL toward the $146.79–$149.67 range, signaling potential upward momentum. Conversely, a drop below $138 could target lower levels around $135.50–$132.74, indicating further downside risk.
The short-term trend remains bullish with EMA12 > EMA26, SMA50 > SMA200, and RSI at 54, reflecting a neutral stance with no immediate overbought or oversold signals. The volatility regime is very low, suggesting subdued price movements.
Drivers
Top factors influencing SOL include:
- 24H return: +0.02
- EMA slope: +0.001, indicating a very mild upward trend
- Funding Z-Score: -0.8, pointing to slight bearish funding conditions
- Basis Z-Score: +1.76, indicating potential bullish basis spread
- Order-book imbalance (EMA5): -0.05, suggesting slight selling pressure
- Bitcoin 24H return: +0.0058, reflecting stable BTC momentum
- Bitcoin volatility regime: high (1), signifying active market conditions
- Bitcoin trend strength: 0.28, indicating moderate momentum
Overall, the momentum remains subdued with low volatility, aligning with the cautious technical outlook.
ETF Flows (BTC/ETH)
Recent ETF flow data shows significant outflows in Bitcoin ETFs, with a 1-day decline of $250M, a 5-day total of nearly $681M, and a 10-day total of over $720M. Ethereum ETFs also experienced outflows, though less severe, with a 1-day decline of $93.8M. These flows suggest a risk-off environment in major cryptocurrencies, which can influence broader market sentiment. However, it is important to note that these ETF flows pertain to BTC and ETH only and serve as contextual factors rather than direct signals for SOL.
What to Watch Next
- Monitor SOL’s price action around key support ($138) and resistance ($144) levels for potential breakout signals.
- Observe broader market liquidity and volatility as ETF flows continue to reflect risk sentiment.
- Keep an eye on Bitcoin and Ethereum ETF flows as leading indicators of risk appetite shifts.
- Watch for any significant changes in technical indicators, especially EMA and RSI, for early trend signals.
Note: ETF flow data is only available for BTC and ETH and provides contextual market sentiment but should not be solely relied upon for SOL trading decisions.
Hashtags: #Solana #CryptoAnalysis #MarketUpdate #BTC #ETH #CryptoFlows #TechnicalAnalysis #CryptoNews #Investing #Blockchain #Altcoins #CryptoTrends