Market Snapshot
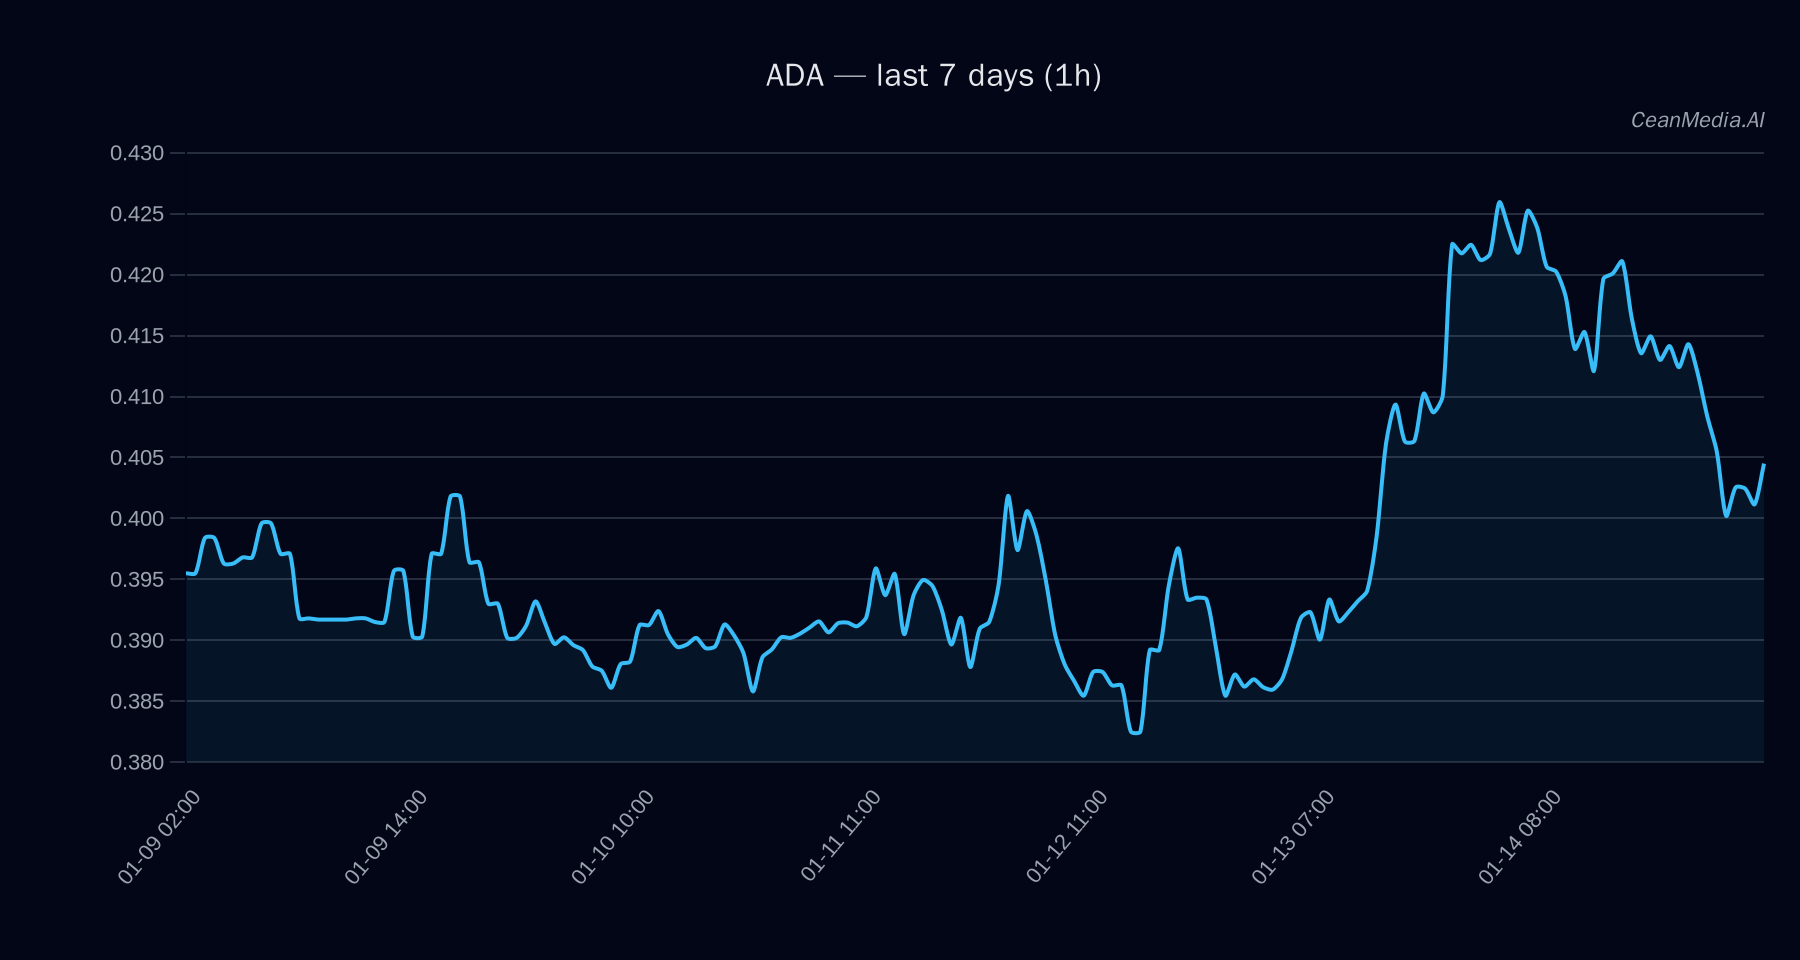
On January 15, 2026, Cardano (ADA) is trading around $0.40, with a short-term forecast indicating a 57% probability of downside movement. The broader market context shows increased ETF inflows into Bitcoin and Ethereum, suggesting a risk-on sentiment in the crypto space. ADA’s technical indicators suggest sideways consolidation within key support and resistance levels, while ETF flows provide additional market context rather than direct signals for ADA.
Technical Analysis: ADA
ADA is currently trading between strong support at approximately $0.365 and resistance near $0.41. A decisive break above $0.41 could push the price towards $0.42–$0.43, while a break below $0.395 may lead to a decline towards $0.38–$0.38. The technical bias remains sideways, with moving averages (EMA12
Drivers
- Return 24H: Slight negative at -0.05, indicating mild short-term weakness.
- EMA Slope: Slight downward slope (-0.001), supporting sideways to bearish outlook.
- Funding Z-Score: -2.25, indicating bearish funding conditions.
- Order Book Imbalance (EMA5): +0.03, suggesting slight buying interest at recent levels.
- Bitcoin 24H Return: +0.01, pointing to stable Bitcoin momentum which can influence altcoins.
- Market Volatility Regime: Very low, indicating subdued trading activity and consolidation.
The overall momentum remains cautious with no strong directional signals, emphasizing the importance of key support/resistance levels for ADA.
ETF Flows (BTC/ETH)
Recent ETF flows show robust inflows into Bitcoin (+$192.2M daily, +$378.7M over 10 days) and Ethereum (+$93.5M daily, +$202.6M over 10 days). These inflows suggest a risk-on environment, favoring major cryptocurrencies. While these flows are only for BTC and ETH and do not directly signal ADA’s movement, they provide context for the broader market sentiment, which may influence altcoin performance indirectly.
What to Watch Next
- Monitor ADA’s price action around the $0.395 support and $0.41 resistance levels for potential breakouts or breakdowns.
- Observe Bitcoin and Ethereum ETF flows for signs of sustained risk appetite, which could support a bullish shift in altcoins.
- Watch for volume confirmation on any breakout above $0.41 or breakdown below $0.395 to validate directional moves.
- Keep an eye on broader market sentiment indicators and funding conditions for signs of changing momentum.
Note: ETF data for BTC and ETH provides market context but should not be solely relied upon for ADA trading decisions.
Hashtags: #CryptoAnalysis #ADA #Cardano #MarketUpdate #ETFFlows #Bitcoin #Ethereum #Altcoins #TechnicalAnalysis #CryptoMarket #RiskOn #Investment