Market Snapshot
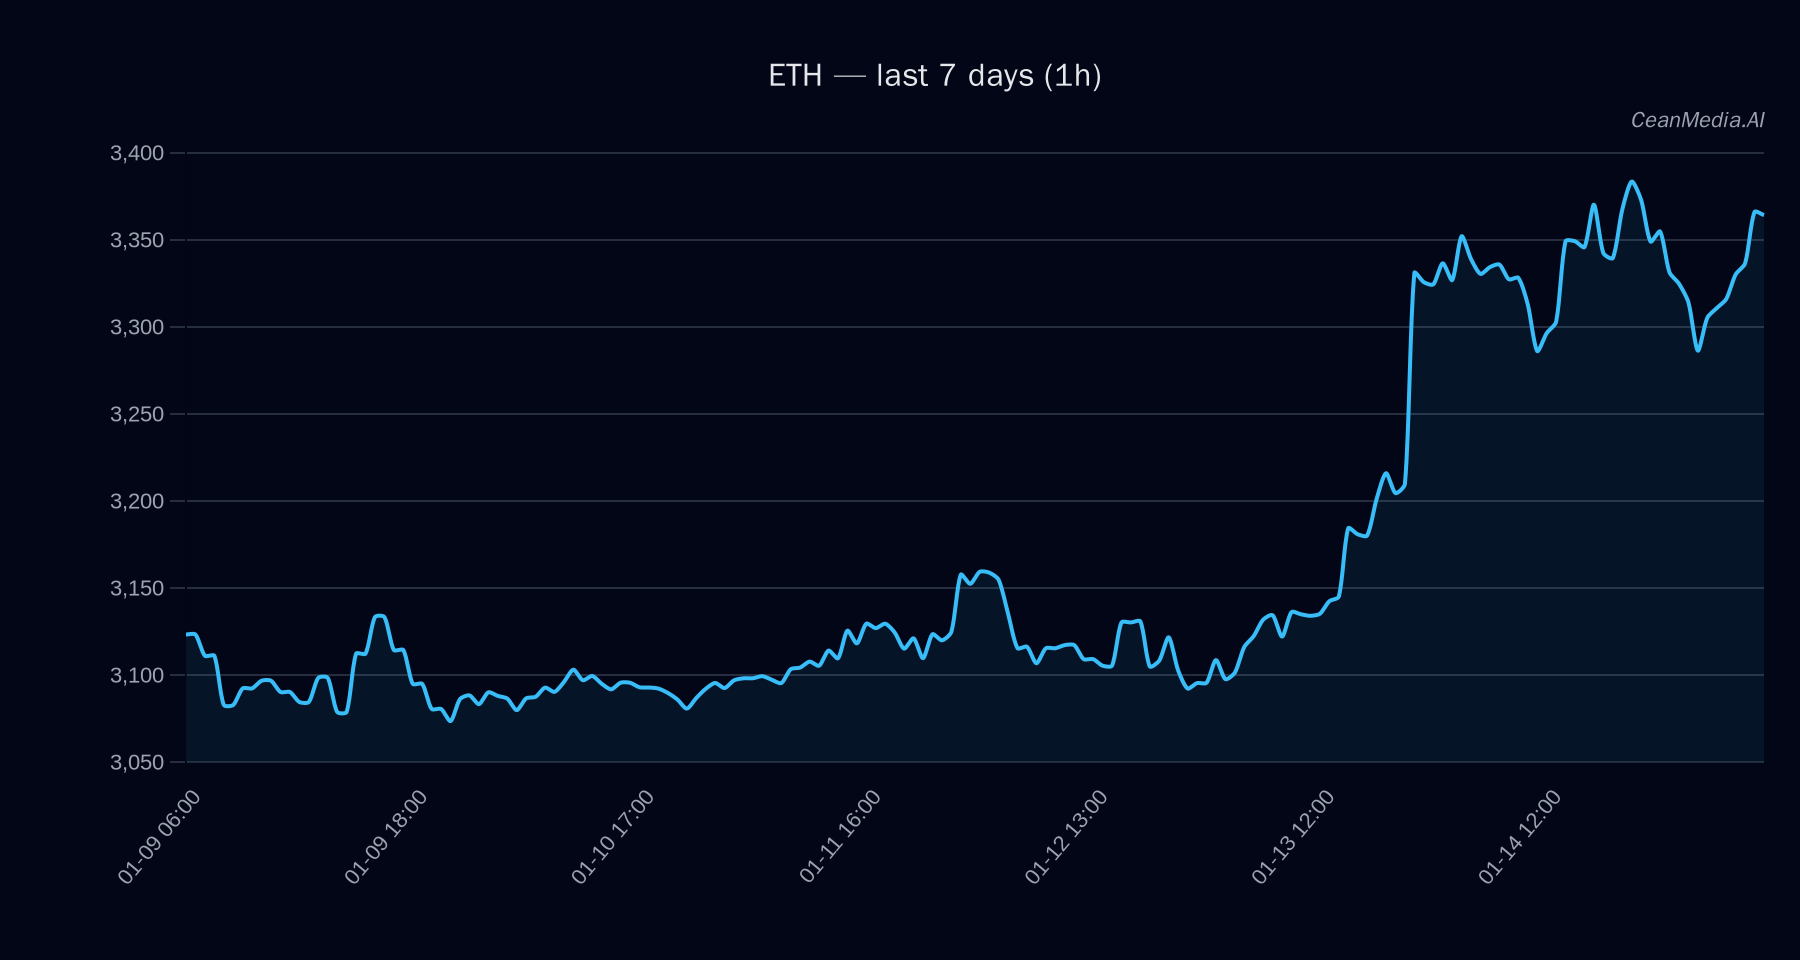
As of January 15, 2026, Ethereum (ETH) is trading around $3,350, with a short-term bias leaning upward at a 47% confidence level. The broader market shows subdued volatility, with a very low 24-hour sigma of 0.59%, indicating a stable environment. Ethereum’s dominance remains steady at 57.5%, with recent ETF flows favoring both Bitcoin and Ethereum, reflecting ongoing institutional interest amidst a cautious risk-on sentiment.
Technical Analysis: ETH
Ethereum is currently trading between key support at approximately $3,284 and resistance at around $3,418. A breakout above $3,418 could target levels near $3,485 to $3,554, confirming bullish momentum. Conversely, a decline below support at $3,284 could see prices slide towards $3,151 to $3,217. The technical indicators remain bullish: the EMA12 is above the EMA26, the SMA50 exceeds the SMA200, and the RSI stands at 57, indicating neutral momentum. The overall bias favors an upward move, with a 47% probability based on current models. Invalidations occur if the price closes below support, while a break above resistance could accelerate gains.
Drivers
- Return 24H: +0.01%
- EMA Slope: +0.0019, indicating mild positive trend
- Funding Z-Score: -1.4, suggesting slight bearish funding pressure
- Basis Z-Score: +0.49
- Spread BP: 0.03 basis points
- ETF Flow (60D): +0.93, reflecting sustained institutional inflows
- Order Book Imbalance (EMA5): +0.27
- Spread Z-Score: -1.03
The market breadth remains healthy at 67%, with a strong correlation to Bitcoin (ρ 72h: 0.74). Volatility remains subdued, supporting a neutral to bullish outlook, while ETF flows continue to be positive for both Bitcoin and Ethereum, indicating ongoing institutional interest.
ETF Flows (BTC/ETH)
Recent ETF data shows that Bitcoin ETFs have experienced inflows over the past 10 days (+$378.7M), with daily inflows of +$192.2M, suggesting a risk-on environment. Ethereum ETFs, however, saw a notable outflow of -$82.7M over the same period, despite recent positive inflows (+$93.5M in 1D and +$202.6M in 10D). These flows indicate a cautious but generally positive institutional stance towards both assets, with Bitcoin slightly leading in risk appetite. It is important to note that ETF flows are only available for BTC and ETH and serve as context rather than primary signals for ETH’s immediate price direction.
What to Watch Next
- Monitor the breakout above $3,418 for confirmation of bullish momentum.
- Watch for a decline below $3,284, which could signal further downside.
- Keep an eye on ETF inflows, especially Bitcoin, as an indicator of broader risk sentiment.
- Observe market breadth and volatility levels for signs of trend acceleration or reversal.
Hashtags: #Ethereum #CryptoAnalysis #MarketUpdate #Bitcoin #ETFs #TechnicalAnalysis #CryptoTrends #DigitalAssets #TradingSignals #Blockchain