Market Snapshot
As of January 16, 2026, BNB is trading around $926.01 with a mixed short-term forecast indicating a 48% probability of upward movement. The current market environment exhibits very low volatility, with key technical indicators suggesting sideways momentum. ETF flows in Bitcoin and Ethereum remain positive over recent periods, providing a broader risk-on context for crypto markets.
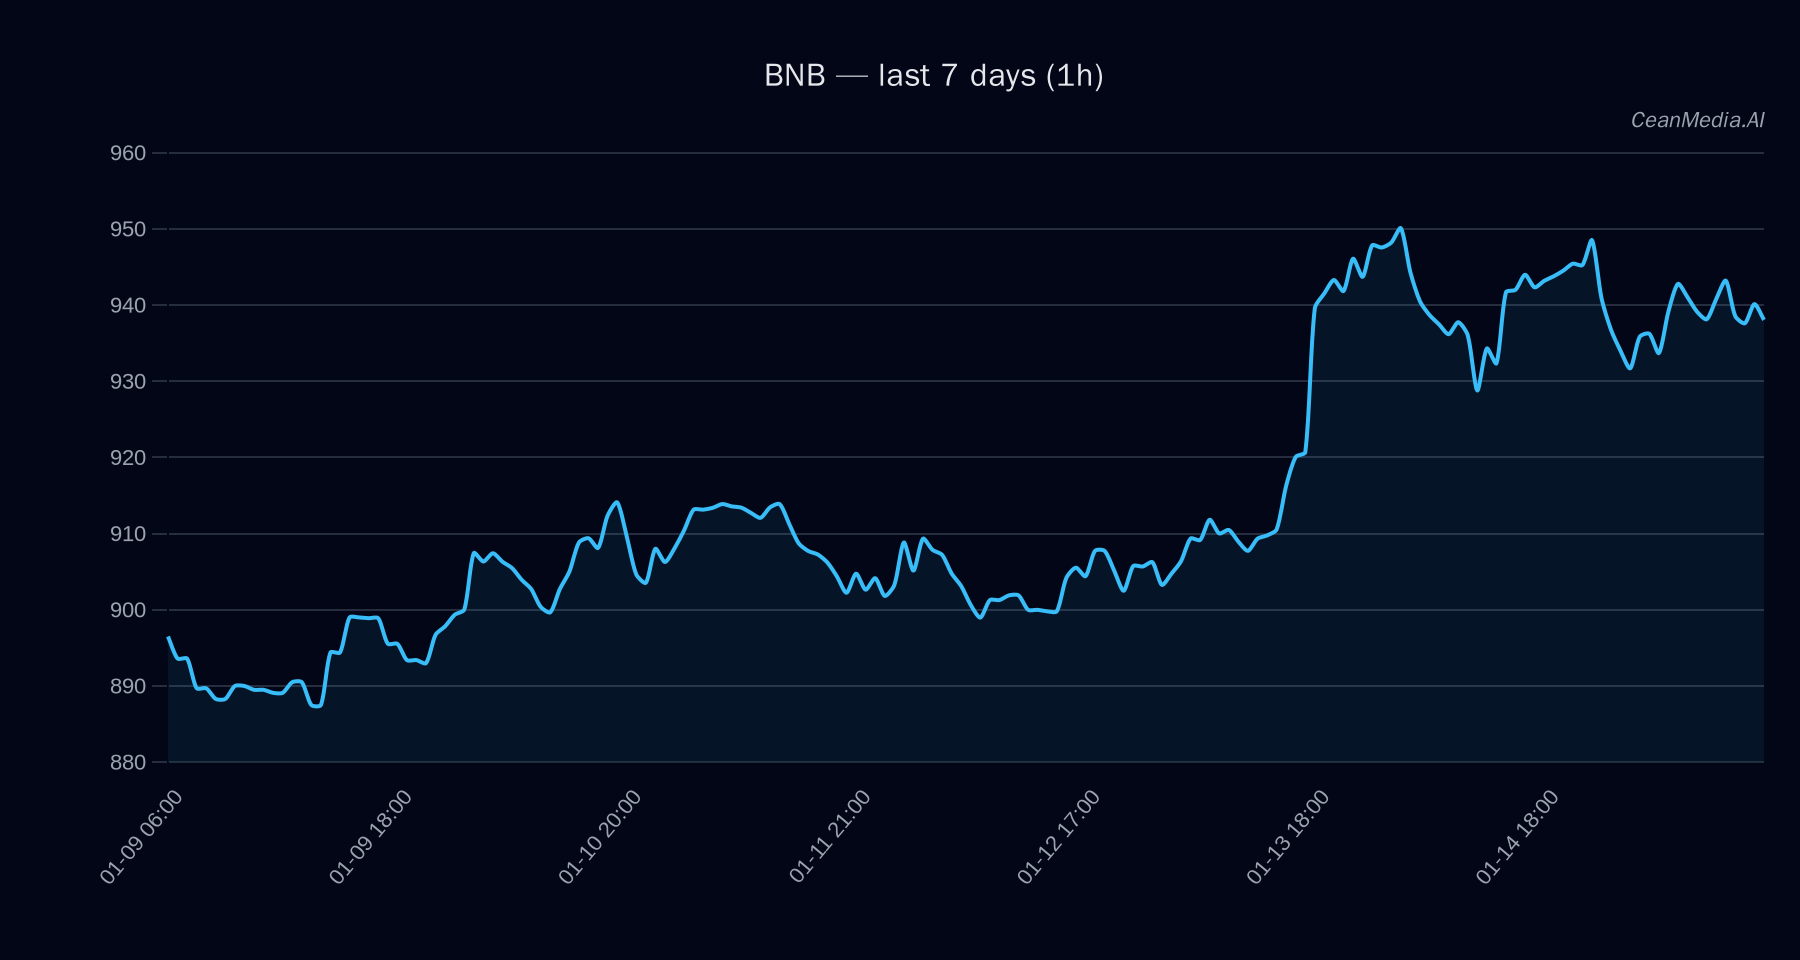
Technical Analysis: BNB
BNB is currently situated between critical support at approximately $907 and resistance at $945. A break above $945 could target levels near $963.42 to $982.31, signaling potential bullish continuation. Conversely, a decline below support at $907 may lead to a decline toward $889.34 to $871.19. The technical setup shows EMA12 below EMA26, and SMA50 above SMA200, indicating sideways momentum with neutral RSI at 37. The volatility regime is very low, further emphasizing consolidation.
Levels:
- Support: Major at $874, Near at $907
- Resistance: Major at $936, Near at $945
Bias & Triggers: The bias is sideways with a slight tilt towards upside if price closes above $945, targeting $963.42–$982.31. A close below $907 could see downside targets of $889.34–$871.19. Invalidations are primarily set by a close above $945 (bullish) or below $907 (bearish).
Drivers
The top drivers influencing BNB include:
- 24H return: -0.45%
- EMA slope: Slight downward trend at -0.0002
- Funding Z-Score: 0.08 indicating neutral funding conditions
- Basis Z-Score: -0.15, signaling slight negative basis pressure
- Order-book imbalance (EMA5): 0.09, suggesting marginal buying interest
- BTC 24H return: -0.34%, reflecting a cautious risk environment
Market momentum remains cautious with very low volatility, and trend strength indicators suggest limited directional bias in the short term.
ETF Flows (BTC/ETH)
Recent ETF flows show sustained inflows into Bitcoin and Ethereum ETFs, with Bitcoin ETFs gaining approximately +$192.2M over 1 day, +$287.6M over 5 days, and +$378.7M over 10 days. Ethereum ETFs also received inflows, though more modest, with +$93.5M over 1 day. These flows indicate a risk-on sentiment in broader crypto markets, which may support bullish sentiment in correlated assets like BNB. However, it is important to note that ETF flows are only related to BTC and ETH and should be considered as contextual rather than primary signals for BNB.
What to Watch Next
- Monitor price action around support at $907 and resistance at $945 for breakout signals.
- Observe changes in ETF flows, especially if Bitcoin and Ethereum continue to attract inflows, indicating broader market risk appetite.
- Keep an eye on technical momentum indicators such as RSI and EMA slopes for early signs of directional shifts.
- Watch for macroeconomic developments and regulatory news that could influence overall market risk sentiment.
Hashtags: #Crypto #BNB #TechnicalAnalysis #ETFFlows #Bitcoin #Ethereum #MarketAnalysis #CryptoInvesting #Altcoins #CryptoSignals #RiskOn #MarketUpdate