Market Snapshot
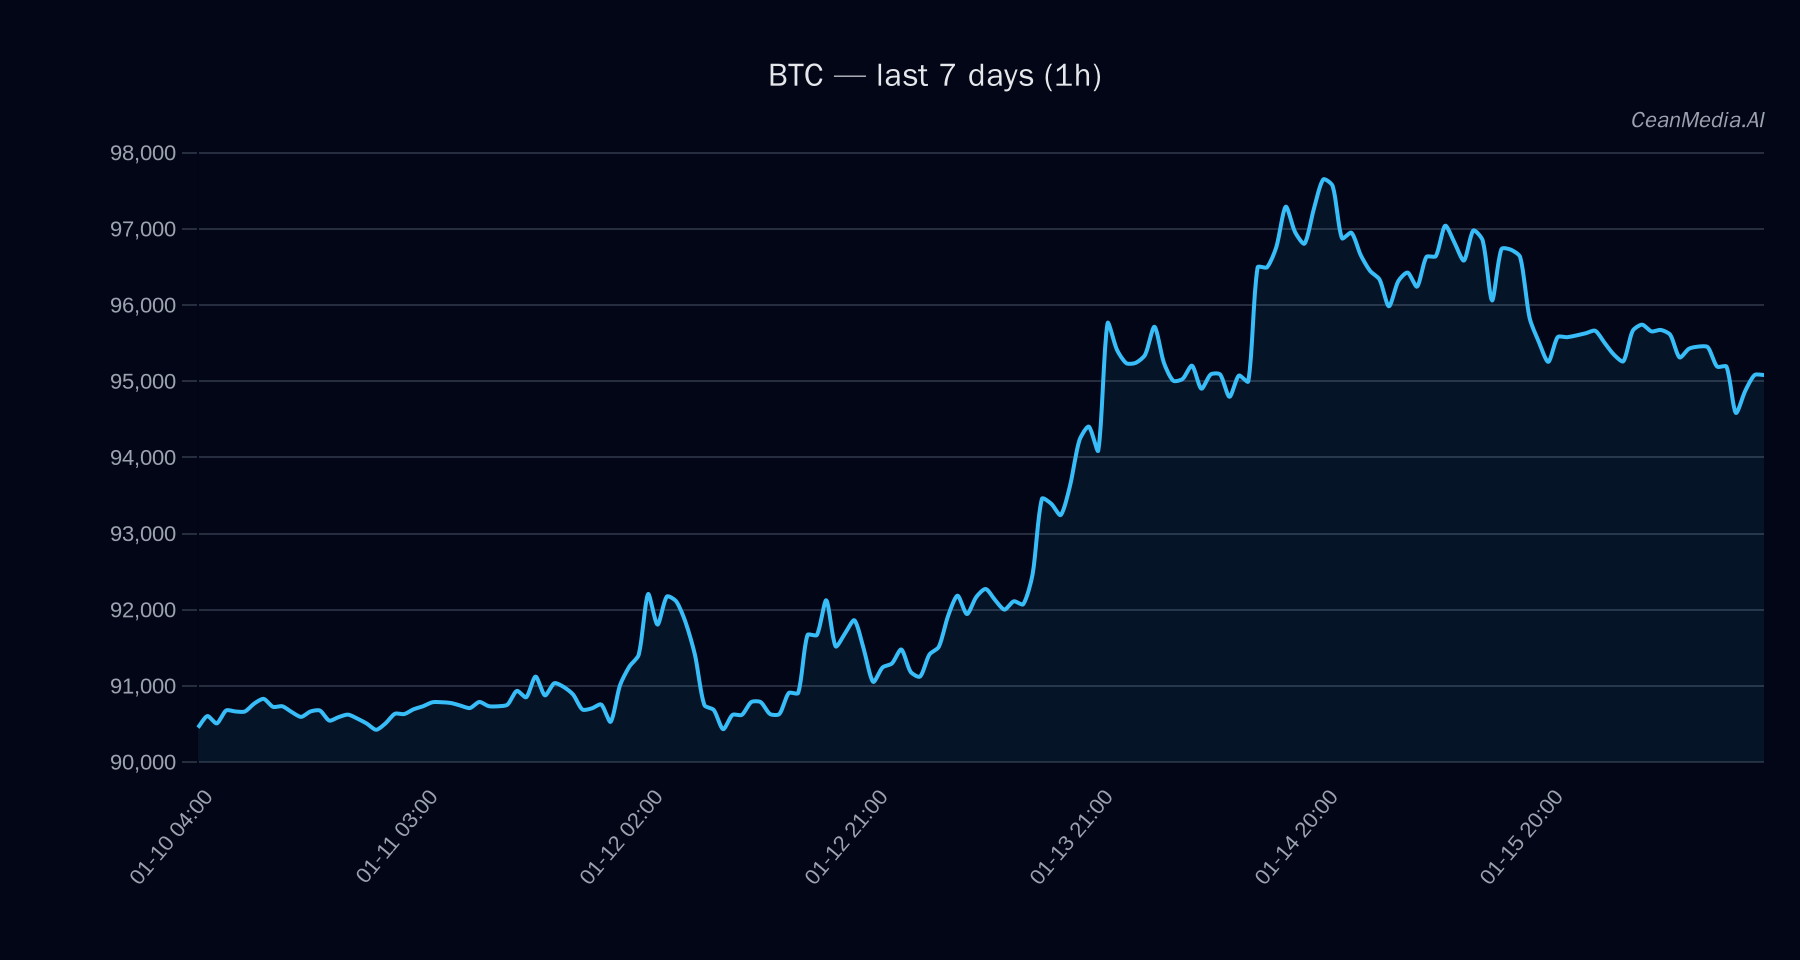
Bitcoin (BTC) is currently trading near key support and resistance levels, with a price of approximately $95,150. The market exhibits low volatility and sideways momentum, with a slight bearish bias indicated by technical signals. ETF flows for BTC and ETH show mixed risk sentiment, providing additional context for short-term market outlook.
Technical Analysis: BTC
- Levels: Major support at $93,250; major resistance at $97,050. Break above resistance targets $98,994 to $100,935. Break below support targets $91,382 to $89,517.
- Bias: Neutral to slightly bearish, with a 50% short-term forecast leaning downward.
- Triggers: A close above $97,050 could accelerate gains towards the upper band, while a close below $93,250 could lead to further declines.
- Invalidation: Breaks outside the support/resistance levels invalidate the current sideways outlook.
- Indicators: EMA12 is below EMA26, SMA50 is above SMA200, RSI is neutral at 43, and volatility remains very low, indicating subdued market activity.
Drivers
- Top factors include minimal 24-hour return (-0.02%) and a slight negative EMA slope (-0.0003), suggesting limited momentum.
- Funding Z-score remains negative (-0.96), implying slight bearish funding pressure, while basis Z-score is positive (1.91), indicating some support for current pricing.
- Order-book imbalance (EMA5) is positive (0.32), hinting at potential buying interest, but overall, the market remains in a low-volatility regime.
- Market breadth is below 50%, and correlation with 72-hour data remains perfect (1.00), emphasizing current indecision.
ETF Flows (BTC/ETH)
ETF flows reveal a nuanced risk sentiment. BTC ETFs saw a short-term outflow of approximately -$26.7 million in 1D, but over the 5D and 10D periods, inflows of +$659.7 million and +$700.1 million suggest renewed institutional interest. Conversely, ETH ETFs experienced consistent inflows (+$15.2 million in 1D, +$91.7 million in 5D, +$289.8 million in 10D), indicating a broader risk-on environment. It is important to note that these flows pertain only to BTC and ETH ETFs and should be considered as supplementary context rather than primary signals for BTC price direction.
What to Watch Next
- Monitor if BTC can break above resistance at $97,050 for potential bullish acceleration.
- Watch for a decisive move below support at $93,250 to confirm bearish momentum.
- Keep an eye on ETF flows, especially ETH inflows, as they may signal shifts in risk appetite.
- Observe changes in volatility regime, which remains very low, for signs of upcoming market shifts.
Hashtags: #Bitcoin #CryptoAnalysis #BTC #MarketUpdate #ETFFlows #CryptoTrading #TechnicalAnalysis #CryptoNews #DigitalAssets #Investing #FinancialMarkets #CryptoInsights