Market Snapshot
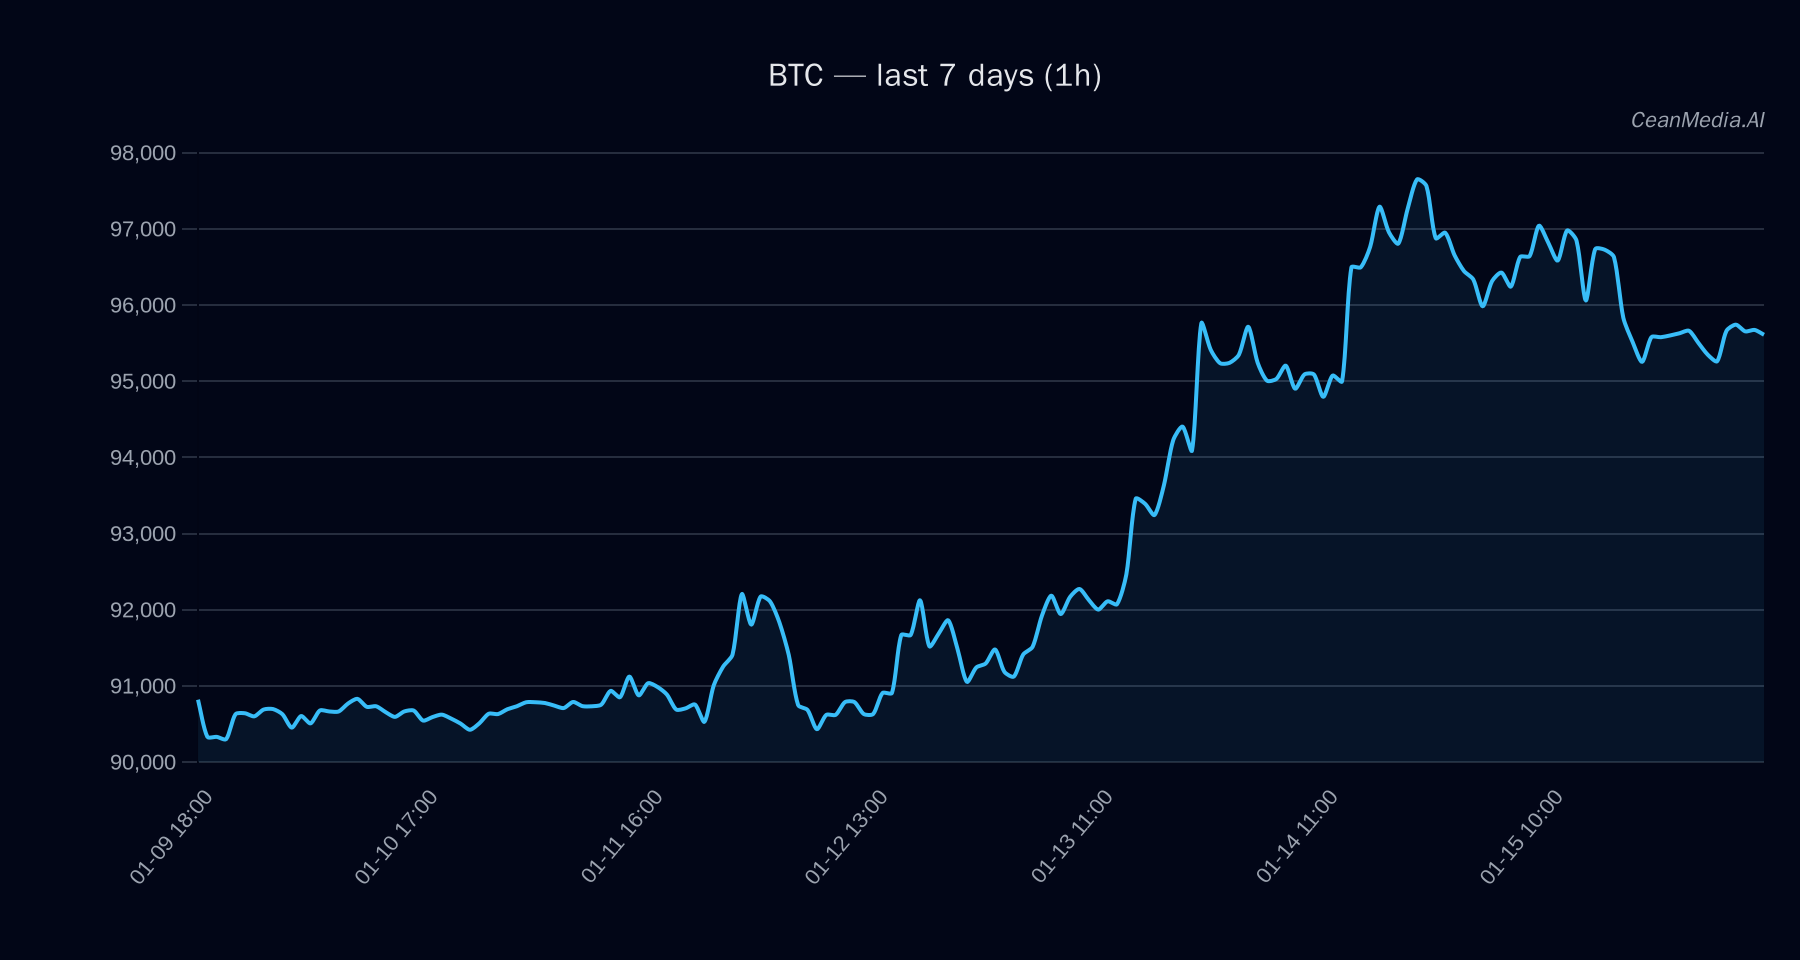
As of January 16, 2026, Bitcoin (BTC) trades around the $95,385 level, with a short-term bias leaning towards a downward move. The market exhibits very low volatility and a sideways trend, with key support at approximately $93,475 and resistance near $97,300. Recent ETF flows show mixed signals, with BTC ETFs experiencing a significant outflow on the daily basis but a substantial inflow over the past 5 and 10 days, while ETH ETFs continue to see inflows, indicating a potential shift in risk appetite.
Technical Analysis: BTC
- Levels: Support at $93,475 (near), Major support at $90,800; Resistance at $97,300 (near), Major resistance at $95,525.
- Bias: Sideways with a slight tilt towards downside, with a 55% probability of decline in the short term.
- Triggers: Break above $97,300 could target $99,239–$101,185; Break below $93,475 could see a decline to $91,608–$89,739.
- Invalidation: A sustained move above $97,300 or below $93,475 would invalidate the current sideways bias and suggest new directional momentum.
Drivers
- Top factors influencing BTC: Slight negative return over 24 hours (-0.01), very low volatility regime, and a neutral RSI at 42.
- Momentum indicators: EMA slope remains marginally negative, signaling weak short-term downward pressure.
- Market sentiment: Funding Z-score and basis Z-score are neutral, with no significant imbalance detected.
- Other drivers: ETF flows indicate cautious optimism over the longer term, with a notable inflow over 5 and 10 days, despite a recent daily outflow.
ETF Flows (BTC/ETH)
Current ETF data shows:
- BTC ETF: 1-day outflow of -$26.7M, but positive inflows over 5 days (+$659.7M) and 10 days (+$700.1M), suggesting growing institutional interest in recent weeks.
- ETH ETF: Consistent inflows with +$15.2M over 1 day, +$91.7M over 5 days, and +$289.8M over 10 days, indicating strong risk-on sentiment toward Ethereum relative to Bitcoin.
While these ETF flows are only for BTC and ETH and serve as context, they reflect broader investor risk appetite and capital allocation trends.
What to Watch Next
- Monitor the price movement relative to the key support at $93,475 and resistance at $97,300 for potential breakouts or breakdowns.
- Observe upcoming macroeconomic data and market sentiment shifts that could influence volatility and trend direction.
- Keep an eye on ETF flow trends, especially continued inflows into ETH, which may signal shifts in investor risk appetite.
- Watch for any significant technical signals that could invalidate the current sideways bias, such as sustained moves above or below key levels.
Hashtags: #Bitcoin #CryptoAnalysis #BTC #MarketUpdate #ETFFlows #TechnicalAnalysis #CryptoTrading #Investment #DigitalAssets #CryptoMarket #FinancialAnalysis #CryptoNews