Market Snapshot
On January 17, 2026, ADA is trading around $0.3961 with a short-term bias leaning towards downside, with a 57% probability of decline according to recent technical signals. The broader market context shows moderate ETF flows in BTC and ETH, indicating mixed risk appetite among investors. Bitcoin ETF flows have been predominantly negative over the past day, while ETH ETF flows continue to show inflows, suggesting a nuanced risk sentiment.
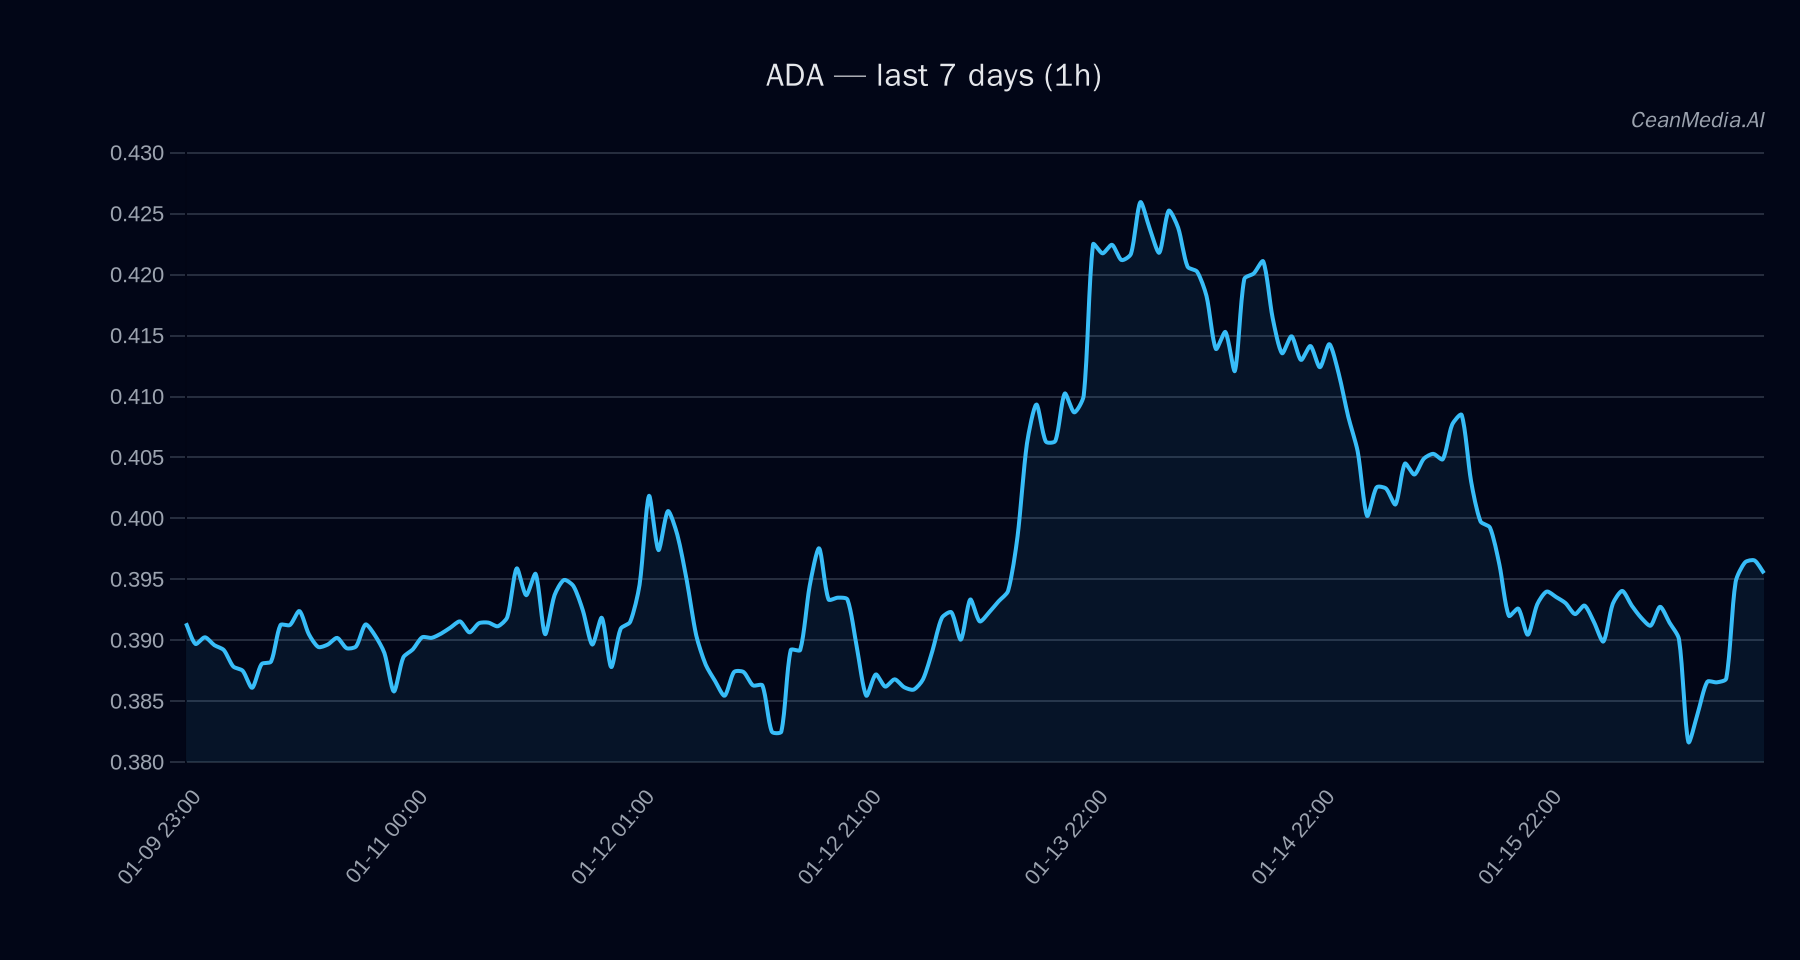
Technical Analysis: ADA
ADA’s current price sits between key support at approximately $0.36 and resistance near $0.405. A breakout above $0.405 could target levels around $0.4121 to $0.4202, signaling a potential short-term upward move. Conversely, a decline below $0.39 would open the path towards $0.3804 to $0.3727. The technical indicators show a sideways trend with EMA12 below EMA26, and the SMA50 above SMA200, indicating a neutral to slightly bearish bias. RSI remains at 55, reflecting a balanced momentum without strong directional pressure.
Drivers
- Return 24H: +0.005
- EMA Slope: 0.0016, indicating minimal upward momentum
- Funding Z-Score: 0.65, suggesting neutral funding conditions
- Basis Z-Score: -0.51, showing slight negative deviation
- Order Book Imbalance (EMA5): 0.02, indicating slight buying pressure
- BTC Return 24H: -0.0005, reflecting minor downside in Bitcoin
- Market Volatility Regime: Very low, implying subdued trading activity
Overall, momentum remains modest with no strong directional signals from the top drivers, and volatility is subdued, supporting a sideways trading environment for ADA.
ETF Flows (BTC/ETH)
Recent ETF data shows that Bitcoin ETFs experienced a significant outflow of $26.7 million over the past day, though inflows over the last 5 and 10 days suggest a broader accumulation trend. Ethereum ETFs, on the other hand, saw inflows of $15.2 million in the past day, with sustained positive flows over longer periods. While these flows are only relevant to BTC and ETH, they provide context for overall risk sentiment. The mixed ETF activity indicates a cautious risk environment, with some investors rotating into ETH and reducing exposure to Bitcoin.
What to Watch Next
- Monitor ADA’s price action around the $0.39 support and $0.405 resistance levels for potential breakout signals.
- Observe broader market sentiment, especially Bitcoin ETF flows, for clues on risk appetite shifts.
- Watch for changes in technical momentum indicators, such as EMA slopes and RSI, for early directional cues.
- Stay alert to macroeconomic developments that could influence ETF flows and overall market risk sentiment.
Note: ETF flows are only available for BTC and ETH and serve as contextual indicators rather than primary signals for ADA’s price movement.
Hashtags: #Crypto #ADA #Bitcoin #Ethereum #ETFFlows #MarketAnalysis #TechnicalAnalysis #CryptoTrading #DigitalAssets #MarketUpdate #Investing #Cryptocurrency