Market Snapshot
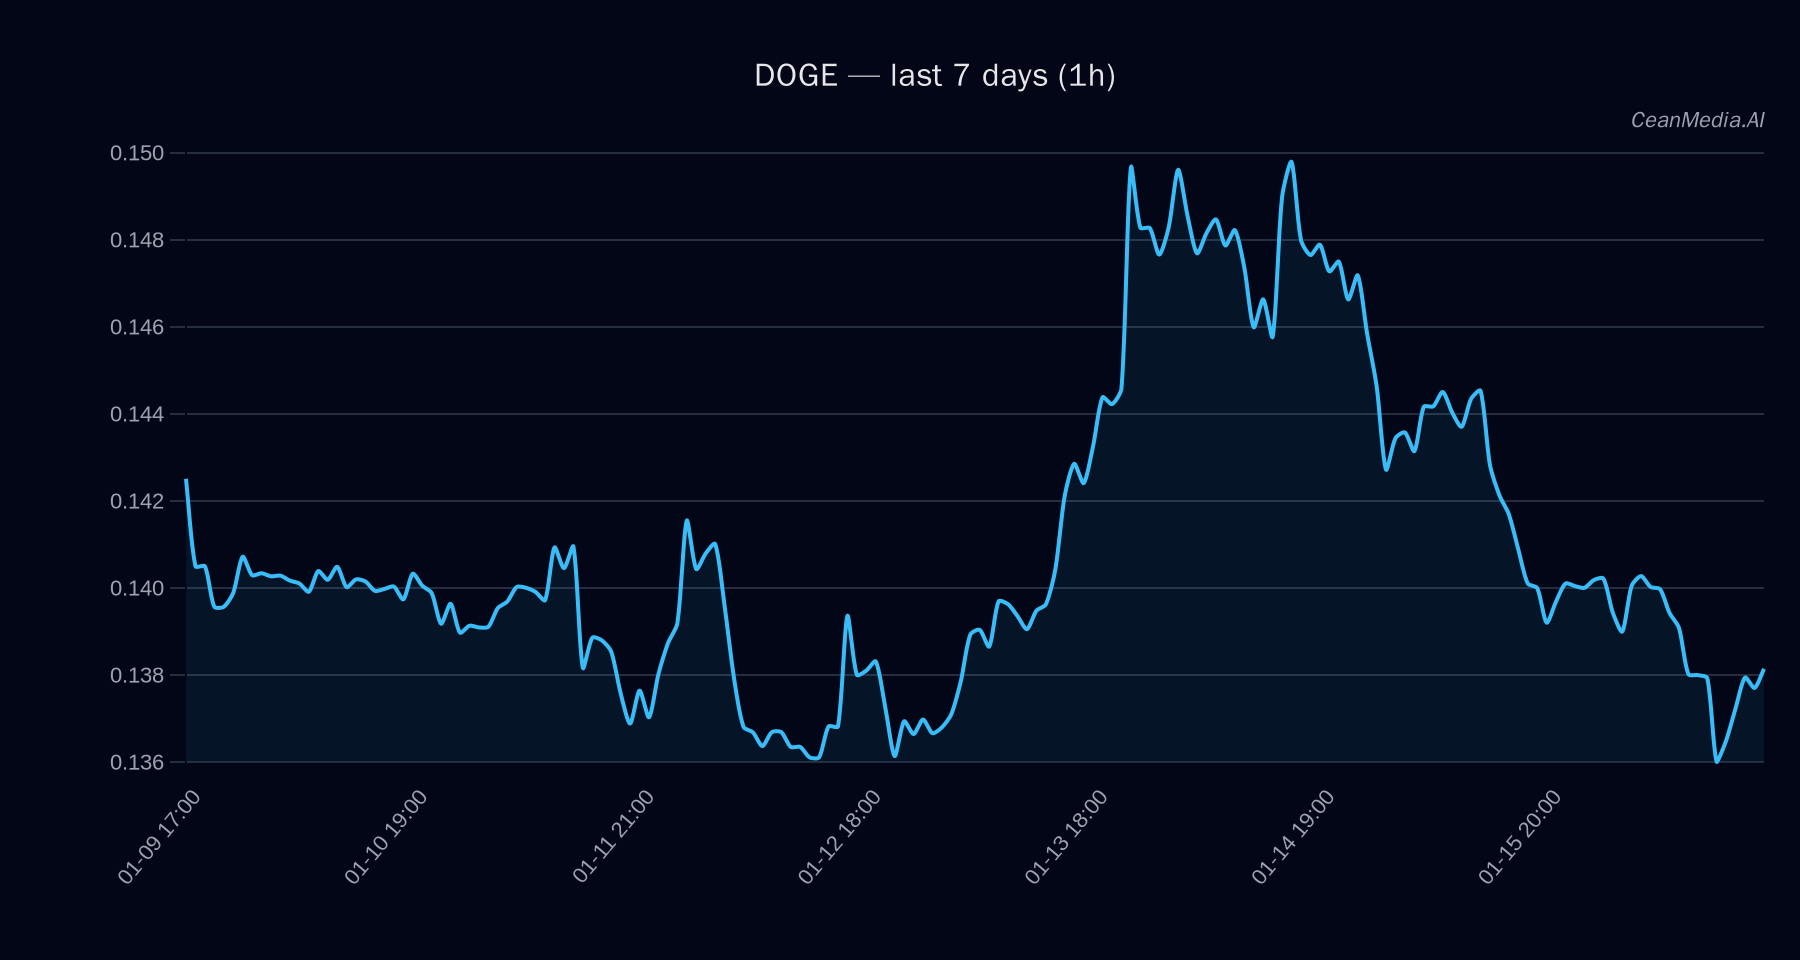
As of January 17, 2026, DOGE is trading at approximately $0.1382, with a neutral to slightly bearish short-term bias. The broader market exhibits very low volatility and subdued momentum, with recent price action confined between key support at $0.135 and resistance at $0.14. ETF flows for Bitcoin and Ethereum indicate mixed risk sentiment, with BTC experiencing outflows and ETH showing inflows over recent periods.
Technical Analysis: DOGE
Current technical indicators suggest a sideways trend for DOGE in the near term. The asset’s price remains between major support at $0.135 and resistance at $0.14. A break above $0.14 could trigger a move towards $0.1438–$0.1466, while a breakdown below $0.135 may see prices decline to approximately $0.1327–$0.13. The EMA12 remains below the EMA26, and the SMA50 is above the SMA200, indicating a lack of strong bullish momentum. The RSI stands at 42, reflecting neutral momentum, and the 24-hour volatility remains very low at 0.46%. The forecast assigns a roughly 50% probability to downside movement within the next 24 hours, emphasizing a cautious stance.
Drivers
- Return 24H: Slight negative at -1%
- EMA Slope: Marginal positive at 0.0002, indicating minimal upward tilt
- Funding Z-Score: -0.64, suggesting slight funding negative pressure
- Order Book Imbalance: -0.04, reflecting balanced order flow with a slight tilt away from buying pressure
- BTC Return 24H: -0.06%, contributing minimal influence on DOGE’s immediate outlook
- Market Volatility Regime: Very low, indicating subdued trading activity
- Trend Strength: Moderate at approximately 0.78, pointing to a lack of strong directional momentum
Overall, the drivers highlight a market in consolidation with no dominant momentum, consistent with the sideways technical pattern observed.
ETF Flows (BTC/ETH)
Recent ETF flow data reveals a divergence in risk sentiment: Bitcoin ETFs experienced net outflows of approximately $26.7 million over the past day, while inflows over the 5- and 10-day periods suggest a cautious risk-off environment. Conversely, Ethereum ETFs saw inflows of $15.2 million daily, with positive flows over longer periods, indicating a slight risk-on bias in ETH. It is important to note that these flows are only for BTC and ETH and serve as contextual indicators rather than direct signals for DOGE’s price action.
What to Watch Next
- Monitor for a decisive break above $0.14 to confirm potential upward momentum toward $0.1466
- Observe if prices break below $0.135, which could accelerate declines toward $0.13
- Keep an eye on broader market volatility and ETF flows, especially ETH inflows, as potential risk sentiment indicators
- Watch for changes in technical momentum indicators, such as RSI and EMA slopes, for early signs of trend shifts
Hashtags: #CryptoAnalysis #DOGE #TechnicalAnalysis #ETFFlows #MarketUpdate #CryptoNews #Bitcoin #Ethereum #Altcoins #MarketSentiment #TradingStrategies #CryptoForecasts