Market Snapshot
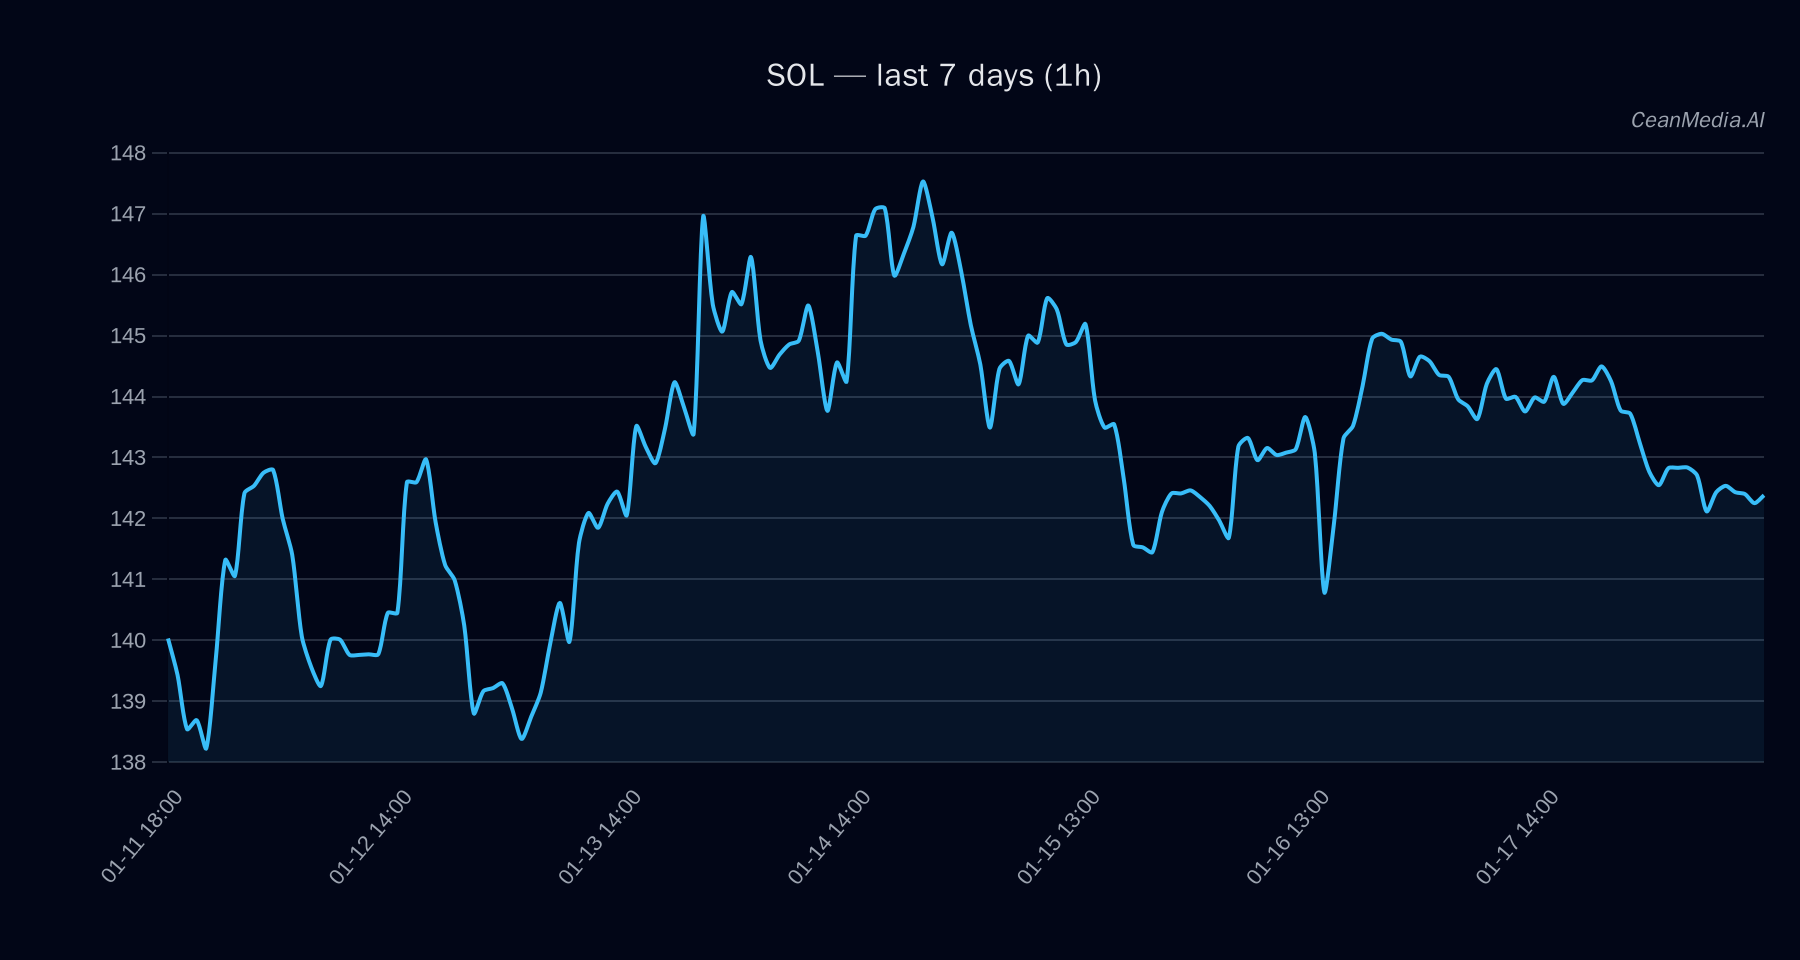
As of January 18, 2026, Solana (SOL) is trading at approximately $142.32. The near-term technical landscape indicates a sideways trend with a slight bearish bias, supported by low volatility and neutral momentum indicators. Broader market flows show mixed signals from BTC and ETH ETFs, suggesting a cautious risk environment.
Technical Analysis: SOL
- Current Levels: Support at 139 (near support), resistance at 145 (near resistance). Major support is at 135, while major resistance is at 144.
- Bias: Sideways with a slight downward tilt; the EMA12 is below EMA26, and the SMA50 remains above SMA200, indicating no immediate bullish momentum.
- Triggers: A close above 145 could push SOL toward 148.07–150.97 in the short term. Conversely, a close below 139 risks a move down to 136.68–133.89.
- Invalidation: A sustained move above 145 or below 139 would invalidate the current sideways bias and suggest potential trend shifts.
Drivers
- Top Factors: Returns over 24 hours are neutral at -0.01, with the EMA slope slightly negative at -0.0003. Funding Z-score remains bearish at -1.74, indicating reduced market funding activity.
- Momentum & Volatility: Market volatility remains very low, with the order book imbalance slightly negative at -0.0088. Bitcoin’s 24-hour return is also flat at -0.003, and its trend strength is moderate at 0.54, providing limited directional cues for SOL.
- Other Indicators: The broad market breadth exceeds 50 hours at 33%, with a 72-hour correlation with BTC at 0.40. Net Bitcoin dominance has increased slightly to 57.4%, reflecting a cautious risk-off sentiment.
ETF Flows (BTC/ETH)
Current ETF flow data shows a divergence between Bitcoin and Ethereum investments. BTC ETFs experienced a significant outflow of approximately $394.7 million in one day but have seen inflows totaling $515 million over five days, indicating cautious risk-off sentiment with some short-term stabilization. ETH ETFs, however, saw positive flows of around $4.7 million in one day and consistent inflows over five and ten days, suggesting a slight risk-on tilt in ETH exposure.
It is important to note that these ETF flows pertain only to BTC and ETH and serve as broader market context rather than direct signals for SOL’s price action. The mixed flows highlight ongoing investor caution amid a low volatility environment.
What to Watch Next
- Monitor for a decisive close above 145 to confirm potential upward breakout targets.
- Watch for a sustained move below 139, which could trigger further downside toward 136–134.
- Observe Bitcoin and Ethereum ETF flows for signs of risk sentiment shifts, although they are secondary to primary technical signals.
- Keep an eye on broader market breadth and correlation metrics for potential shifts in market dynamics.
Hashtags: #Solana #CryptoAnalysis #MarketUpdate #BTC #ETH #CryptoTrading #TechnicalAnalysis #ETFFlows #MarketSentiment #DigitalAssets #Blockchain