Market Snapshot
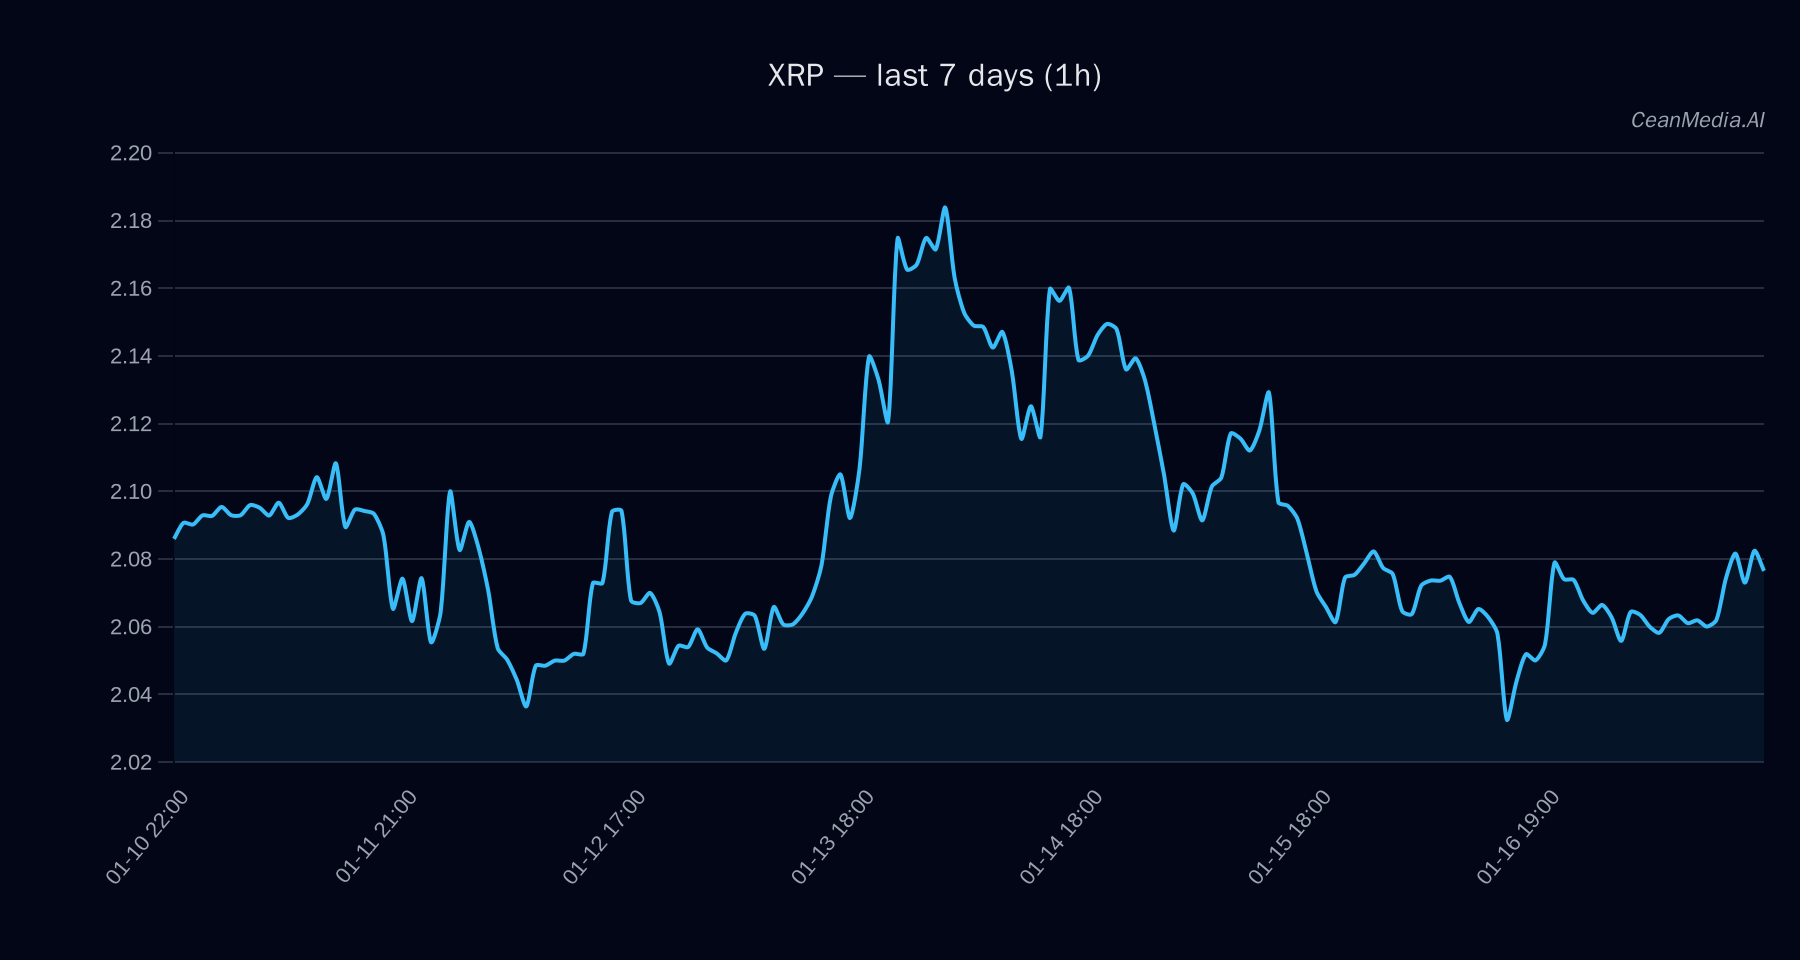
As of January 18, 2026, XRP is trading around the $2.0757 level, with a short-term bias leaning towards a potential downward move. The asset is currently situated between key support at approximately $2.04 and resistance near $2.12. Recent market breadth remains strong at over 83%, and overall altcoin market conditions suggest a neutral to sideways trend in the short term. Bitcoin and Ethereum ETF flows indicate a cautious risk environment, primarily characterized by outflows in Bitcoin ETFs and modest inflows in Ethereum ETFs over recent days.
Technical Analysis: XRP
- Levels to Watch: Support at $1.90 (major), near-term support at $2.04; Resistance at $2.24 (major), near resistance at $2.12.
- Current Bias: Sideways with a slight tilt towards downside; probability of downward movement at approximately 48% based on recent signals.
- Triggers: A close above $2.12 could accelerate towards $2.16–$2.20; a close below $2.04 may lead to a decline towards $1.99–$1.95.
- Invalidation: Break below $1.90 would suggest further downside, invalidating the current sideways bias.
- Indicators: EMA12 above EMA26, SMA50 below SMA200, RSI at 55—indicating neutral momentum; very low volatility regime supports limited directional move in the near term.
Drivers
- Top Factors: 24-hour return at 0.01%, EMA slope marginally positive, basis Z-score at 0.86, funding Z-score slightly negative at -0.58, order-book imbalance modest at 0.05.
- Market Momentum and Volatility: BTC’s 24-hour return is minimal at 0.0045, with a declining volatility regime (-1), indicating subdued market activity. Trend strength remains moderate at 0.56, supporting a cautious outlook.
ETF Flows (BTC/ETH)
Current ETF data shows Bitcoin ETFs experiencing notable outflows over the past day (-$409.8M), but with inflows over the past 5 days (+$499.9M), suggesting a short-term risk-off sentiment. Ethereum ETFs, on the other hand, exhibit minor daily outflows (-$10.2M) but positive flows over 5 and 10 days, indicating a slightly more resilient stance. These flows serve as a broader market context, not direct signals for XRP, but they reflect a cautious risk environment that could influence overall sentiment.
What to Watch Next
- Monitor XRP’s close relative to $2.12 for potential bullish acceleration.
- Keep an eye on the $2.04 support level for signs of weakness.
- Observe broader market sentiment, especially BTC and ETH ETF flows, for risk-on/off cues.
- Watch for any breakout or breakdown triggers that could shift the current sideways bias.
Hashtags: #XRP #CryptoAnalysis #MarketUpdate #TechnicalAnalysis #ETFFlows #Bitcoin #Ethereum #Altcoins #CryptoTrends #RiskOff #MarketNeutral #CryptoForecast