Market Snapshot
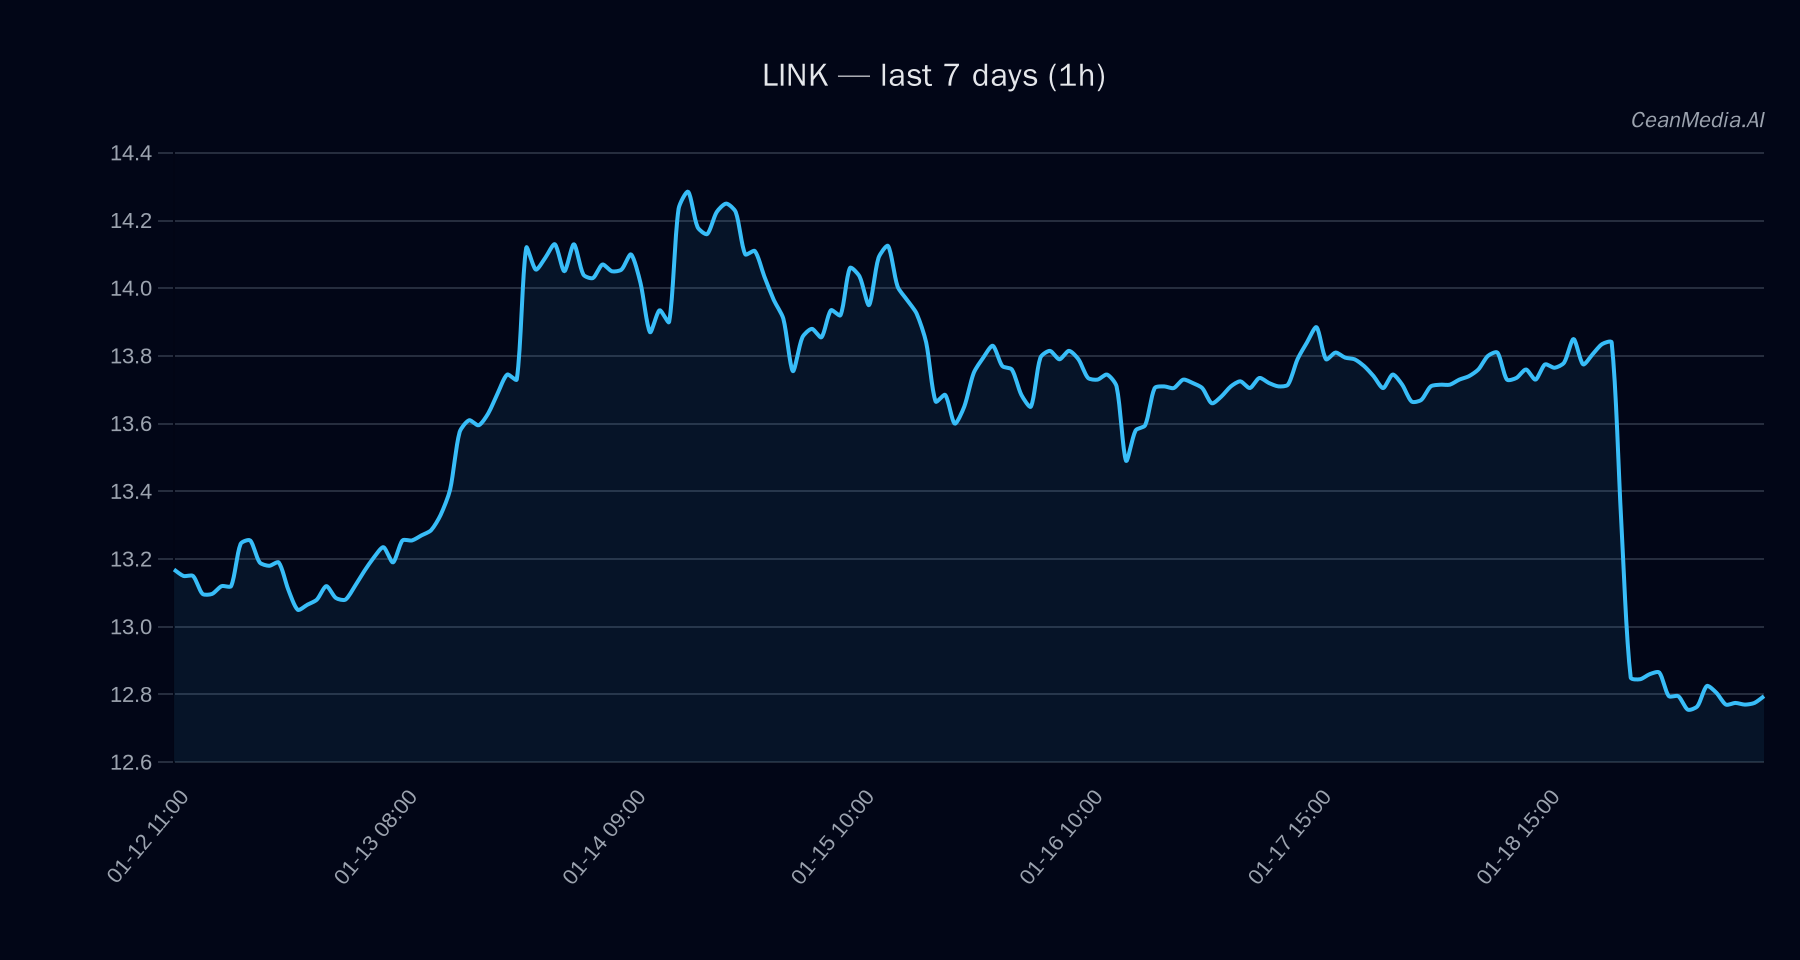
On January 19, 2026, LINK is trading near $12.84, with a short-term bearish bias indicated by technical signals. The asset remains within a defined support and resistance zone, with key levels at $12.6 (support) and $13.1 (resistance). Recent ETF flows for BTC and ETH suggest mixed investor sentiment in the broader crypto market, which should be considered as contextual background rather than direct signals for LINK.
Technical Analysis: LINK
- Levels: Support at 12.6, Resistance at 13.1. Break above 13.1 aims for 13.36–13.62; break below 12.6 targets 12.08–12.33.
- Bias: Bearish in the short term, with a 51% probability of decline based on current technical indicators.
- Triggers: A close above 13.1 on the 1-hour chart would signal potential upward movement; a close below 12.6 would confirm further downside.
- Invalidation: Break below 12.6 invalidates the support and suggests continued downward pressure.
Technical conditions include EMA12 below EMA26, SMA50 below SMA200, and RSI at 29, indicating oversold conditions. The market exhibits low volatility and weak momentum, consistent with a bearish outlook.
Drivers
- Top factors: Slight negative 24-hour return (-0.07%), negative EMA slope (-0.001), and a funding Z-score of -2.61 indicating bearish sentiment among traders.
- Momentum and volatility: Trend strength remains high at approximately 1.3, but overall market breadth remains weak at 0%, reflecting limited participation.
- Additional context: BTC’s 24-hour return is slightly negative (-0.02%), and Bitcoin’s volatility regime remains stable at 1, supporting a cautious outlook for altcoins like LINK.
ETF Flows (BTC/ETH)
Recent ETF data shows a divergence: BTC ETFs experienced a net outflow of approximately $394.7 million in one day, but inflows over five and ten days suggest some investor interest returning. Conversely, ETH ETFs saw inflows of $4.7 million in one day, with positive flows over five and ten days. These flows indicate a potential risk-on environment for ETH, while BTC remains under some selling pressure. This macro backdrop provides context but should not be solely relied upon for LINK trading decisions.
What to Watch Next
- Monitor the 13.1 resistance level for potential breakout signals.
- Watch for a sustained move below 12.6 to confirm further downside.
- Keep an eye on broader market sentiment, especially BTC and ETH ETF flows, for risk appetite cues.
- Observe RSI and moving average crossovers for early trend indications.
Hashtags: #Crypto #LINK #TechnicalAnalysis #MarketUpdate #BTC #ETH #ETFFlows #Altcoins #TradingSignals