Market Snapshot
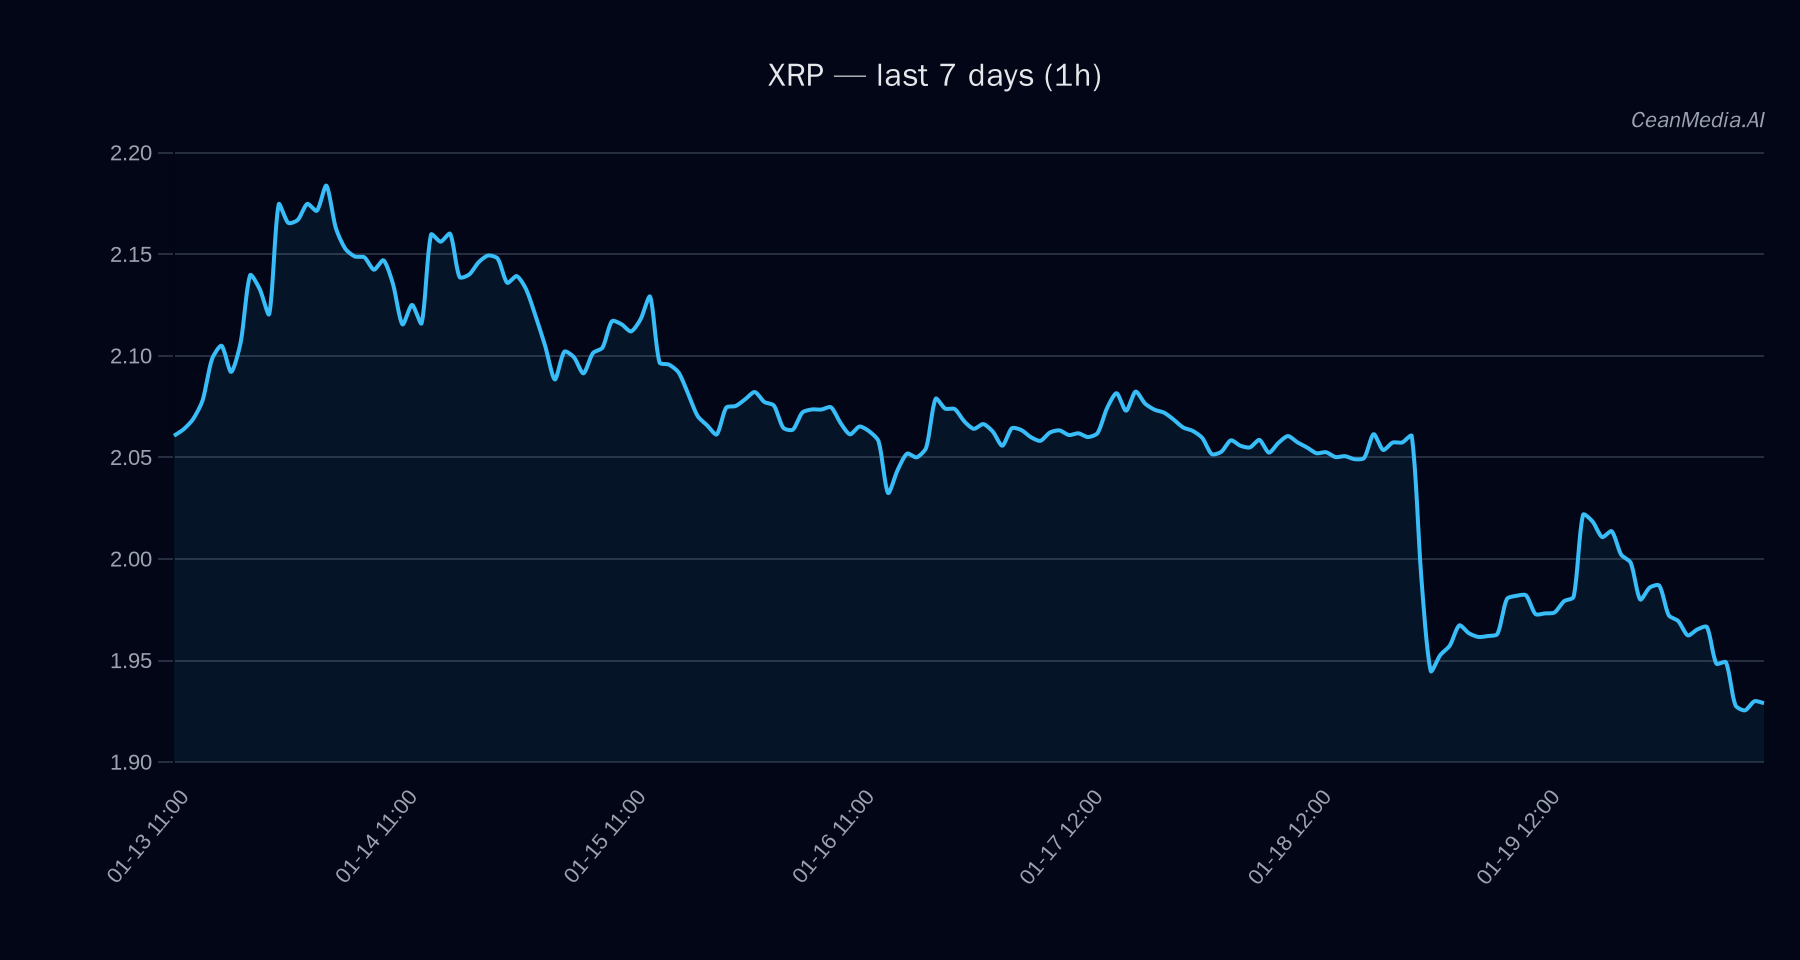
As of January 20, 2026, XRP is trading around the 1.93 level, situated between key support at 1.88 and resistance at 1.96. Recent market sentiment shows a very low volatility regime with the RSI at oversold levels (29), indicating potential for a short-term rebound. Broader market dynamics include a slight decline in 24-hour returns and a cautious risk environment reflected in the Fear & Greed index at 32. Bitcoin dominance remains elevated at 57.6%, with slight weekly increases, while altcoin breadth remains subdued.
Technical Analysis: XRP
- Levels to Watch: Support at 1.88, resistance at 1.96. A break above 1.96 could target 2.006–2.0453, while a drop below 1.88 may lead to 1.814–1.852.
- Bias: Bearish in the short term due to EMA12
- Triggers: A close above 1.96 on the 1-hour chart would signal potential upward momentum; a close below 1.88 indicates further downside.
- Invalidation: Sustained movement above 2.12 or below 1.81 would suggest a change in trend bias.
Drivers
- Top Factors: 24H return at -0.02, EMA slope at -0.0019, funding Z-score at 0.31, basis Z-score at -0.57.
- Market Momentum & Volatility: Low volatility regime with very low 24H BTC volume change, BTC trend strength at 1.7, and a negative 30-day drawdown of approximately 19.4%.
- Market Sentiment: The Fear & Greed index at 32 indicates a cautious or slightly fearful market environment.
ETF Flows (BTC/ETH)
Recent ETF flows reveal a divergence between Bitcoin and Ethereum. BTC ETFs have seen a net outflow of approximately $394.7M over one day but accumulated a net inflow of $515.0M over five days, suggesting short-term risk-off sentiment with some stabilization. Conversely, ETH ETFs experienced inflows totaling around $4.7M in one day and positive flows over longer periods, indicating a slightly more risk-on stance for ETH. While these flows are only for BTC and ETH, they provide context for overall market risk appetite, which could influence XRP indirectly.
What to Watch Next
- Monitor the 1-hour close for a breakout above 1.96 or below 1.88 to confirm directional bias.
- Observe broader market sentiment shifts, especially in Bitcoin and Ethereum ETF flows, for potential risk-on or risk-off signals.
- Keep an eye on the RSI for oversold or overbought signals to gauge short-term reversals.
- Watch for any macroeconomic developments that could impact liquidity and market volatility.
Disclaimer: ETF flows for BTC and ETH are provided as context and are not primary signals for XRP trading decisions.
Hashtags: #XRP #CryptoAnalysis #MarketUpdate #BTC #ETH #ETFFlows #TechnicalAnalysis #CryptoTrends #MarketSentiment #TradingStrategy #DigitalAssets