Market Snapshot
On January 21, 2026, ADA is trading near $0.36, with market sentiment leaning towards a bearish short-term outlook. The broader crypto environment shows extreme fear, with Bitcoin dominance slightly increasing and low volatility regimes prevailing. ETF flows for Bitcoin and Ethereum remain predominantly negative over one and five days, indicating risk-off sentiment in traditional markets.
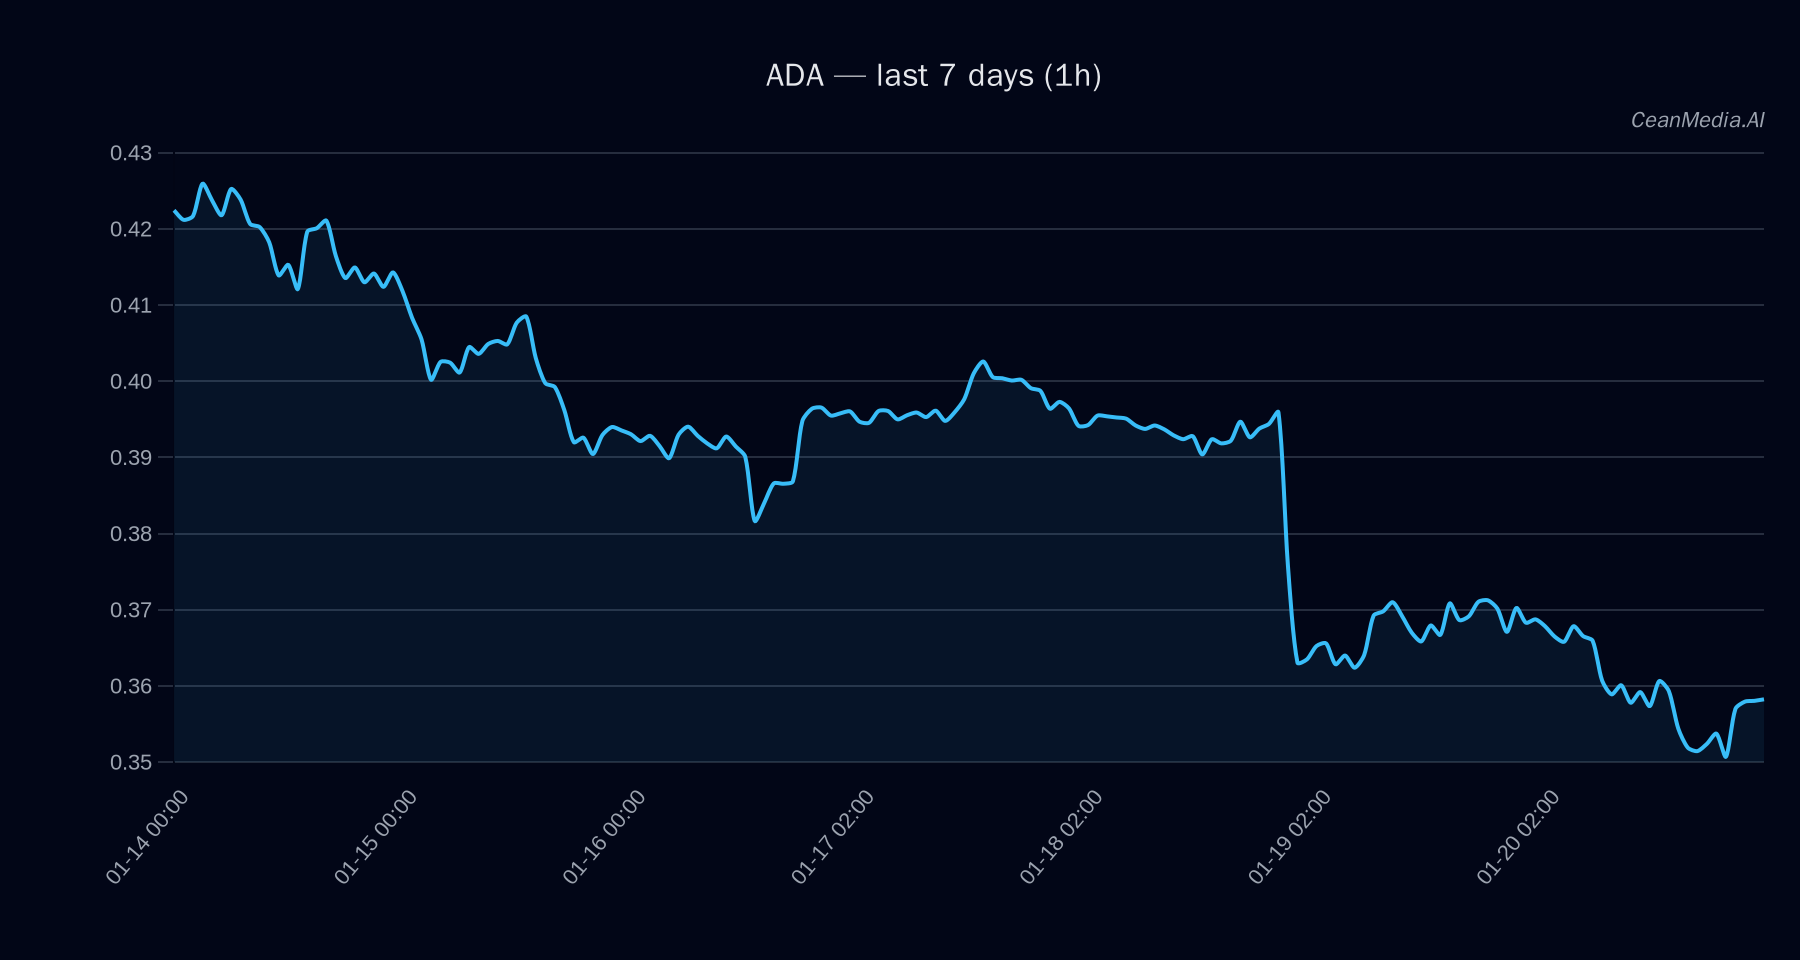
Technical Analysis: ADA
ADA is currently situated between key support at approximately $0.355 and resistance at around $0.365. The short-term trend remains bearish as indicated by the EMA12 being below EMA26, and the SMA50 below SMA200, reflecting downward momentum. The RSI is neutral at 50, but the overall bias suggests a likely continuation of the downtrend unless a decisive break above $0.365 occurs. A close above $0.365 could target a move towards $0.3745–$0.3819. Conversely, a close below $0.355 may push the price towards $0.3387–$0.3457, invalidating the current support levels.
Drivers
- Return 24H: Slight negative at -2.25%
- EMA Slope: Mild upward slope at 0.0008 indicating minimal short-term momentum
- Funding Z-Score: -1.03, signaling slight bearish funding sentiment
- Basis Z-Score: 0.46, indicating neutral basis conditions
- Order Book Imbalance (EMA5): Slight positive at 0.01
- 7-Day Realized Volatility: 4%, reflecting low volatility environment
Overall, momentum remains subdued with low volatility and neutral technical signals, aligning with the broader risk-averse market sentiment.
ETF Flows (BTC/ETH)
Current ETF flows for Bitcoin and Ethereum over the past 24 hours and five days show significant outflows, with Bitcoin ETFs down by nearly $423 million in one day and over $1.29 billion in ten days. Ethereum ETFs also experienced notable outflows, although with some recovery over five days. These patterns suggest a cautious risk-off environment, which could impact altcoins like ADA indirectly. It is important to note that ETF flows for BTC and ETH are only contextual and not primary signals for ADA’s price action.
What to Watch Next
- Monitor ADA’s ability to break above the key resistance at $0.365 for a potential bullish move.
- Watch for a sustained move below $0.355 that could accelerate the downtrend towards $0.3387.
- Keep an eye on broader market sentiment and ETF flows, especially in Bitcoin and Ethereum, for clues on risk appetite.
- Observe changes in volatility regime and funding rates which could signal shifts in market dynamics.
Hashtags: #Crypto #ADA #Bitcoin #Ethereum #MarketAnalysis #TechnicalAnalysis #ETFFlows #Altcoins #CryptoNews #PriceForecast #MarketSentiment