Market Snapshot
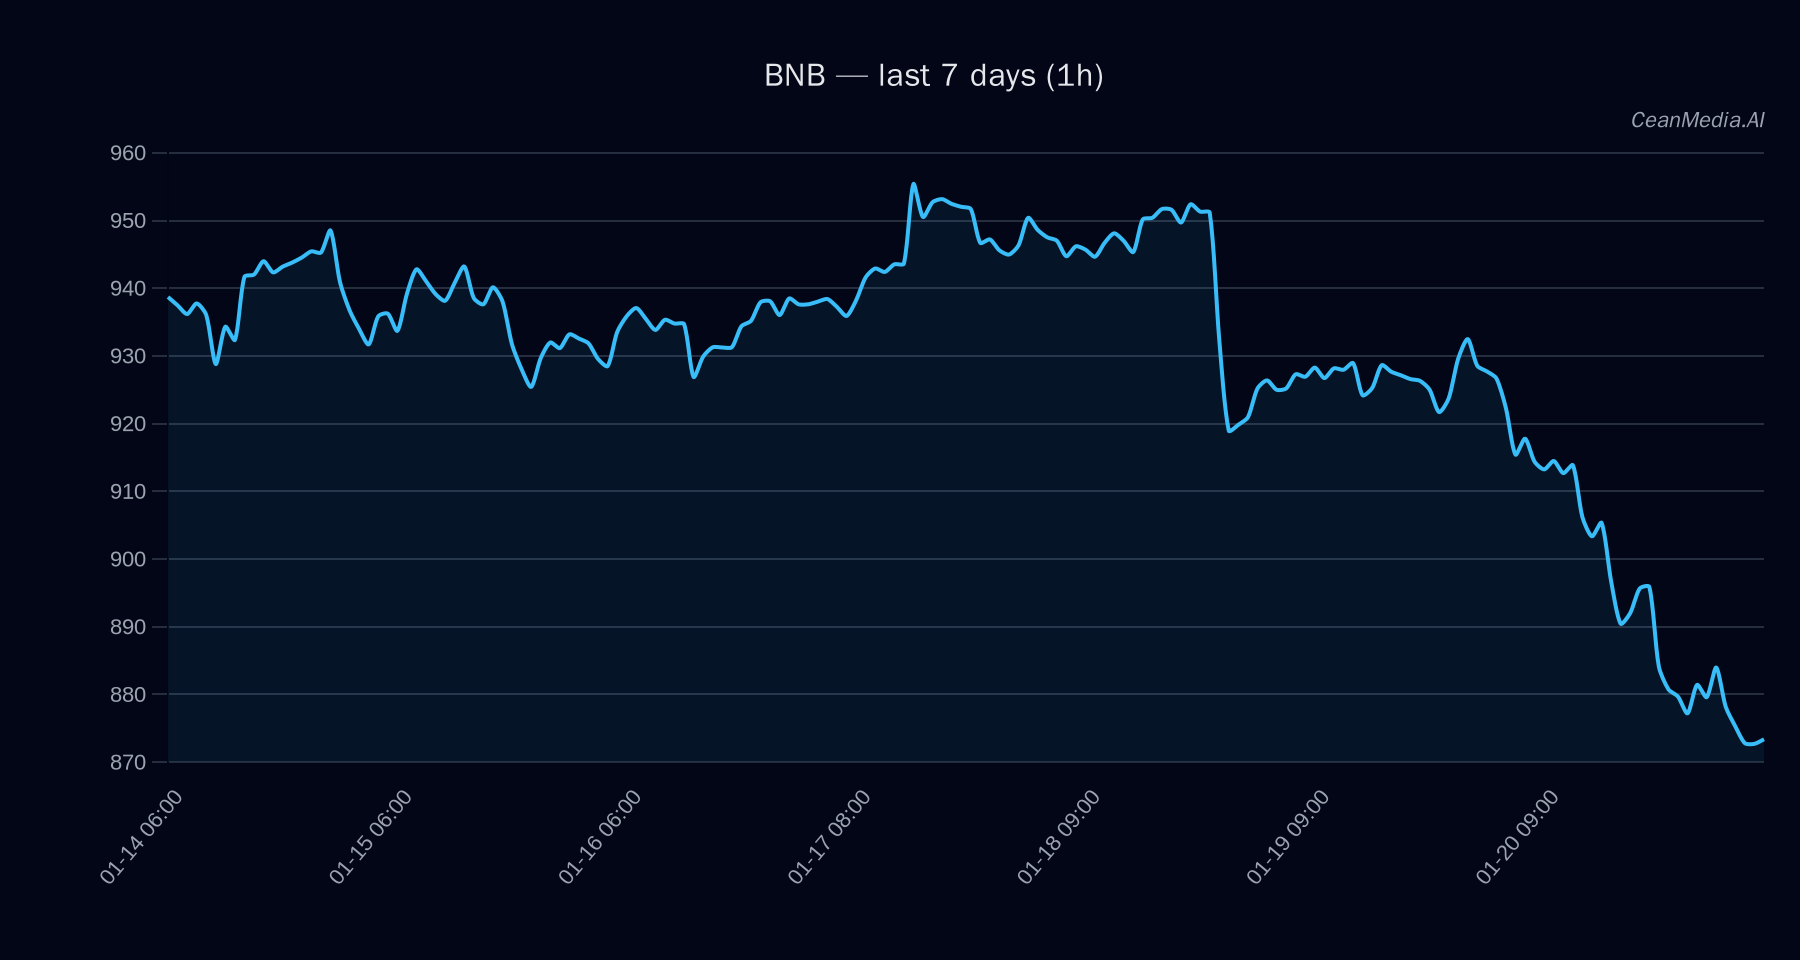
As of January 21, 2026, BNB is trading around 873.39, with a short-term forecast indicating a 55% probability of upward movement. The broader market sentiment is characterized by extreme fear, with Bitcoin dominance slightly increasing. ETF flows for BTC and ETH are negative over multiple timeframes, suggesting risk-off sentiment in traditional crypto markets, which provides contextual background for BNB’s current technical stance.
Technical Analysis: BNB
- Levels: Support at 856 (near support), major support at 890; Resistance at 891 (near), major resistance at 922.
- Bias: Bearish with oversold RSI at 27, EMA12 below EMA26, and SMA50 below SMA200, indicating potential for a rebound but current momentum remains cautious.
- Triggers: A close above 891 could target 908.67–926.49; a close below 856 would open downside targets of 838.80–821.68.
- Invalidation: Break below 856 invalidates near-term bullish cases, while sustained close above 891 confirms potential upward breakout.
Drivers
- Top Factors: Return over 24 hours at -0.04, EMA slope at -0.0014, and funding and basis Z-scores indicating oversold conditions (-0.86 and -1.58 respectively).
- Momentum & Volatility: Low volatility regime (σ24h 0.45%), very low volume regime, and trend strength around 2.3 suggest subdued market activity but potential for a reversal given oversold RSI.
ETF Flows (BTC/ETH)
Current ETF flows show significant outflows: BTC ETFs have seen a 1-day decline of -$479.7M, 5-day -$81.4M, and 10-day -$1.34B. ETH ETF flows are similarly negative, with -$230.0M over 1 day, -$39.9M over 5 days, and -$278.0M over 10 days. These outflows highlight risk-off sentiment in traditional crypto markets; however, these are only context for BNB and should not be directly interpreted as primary signals for its movement.
What to Watch Next
- Monitor if BNB can close above the 891 resistance level to confirm potential upward breakout.
- Watch for a sustained move below 856 support, which could signal further downside.
- Keep an eye on overall market sentiment and ETF flows, especially in BTC and ETH, for broader risk appetite cues.
- Observe RSI and trend indicators for signs of reversal or continued bearishness.
Hashtags: #BNB #CryptoAnalysis #TechnicalAnalysis #ETFFlows #MarketSentiment #CryptoTrading #Binance #Altcoin #RiskOn #RiskOff #CryptoTrends #Investing