Market Snapshot
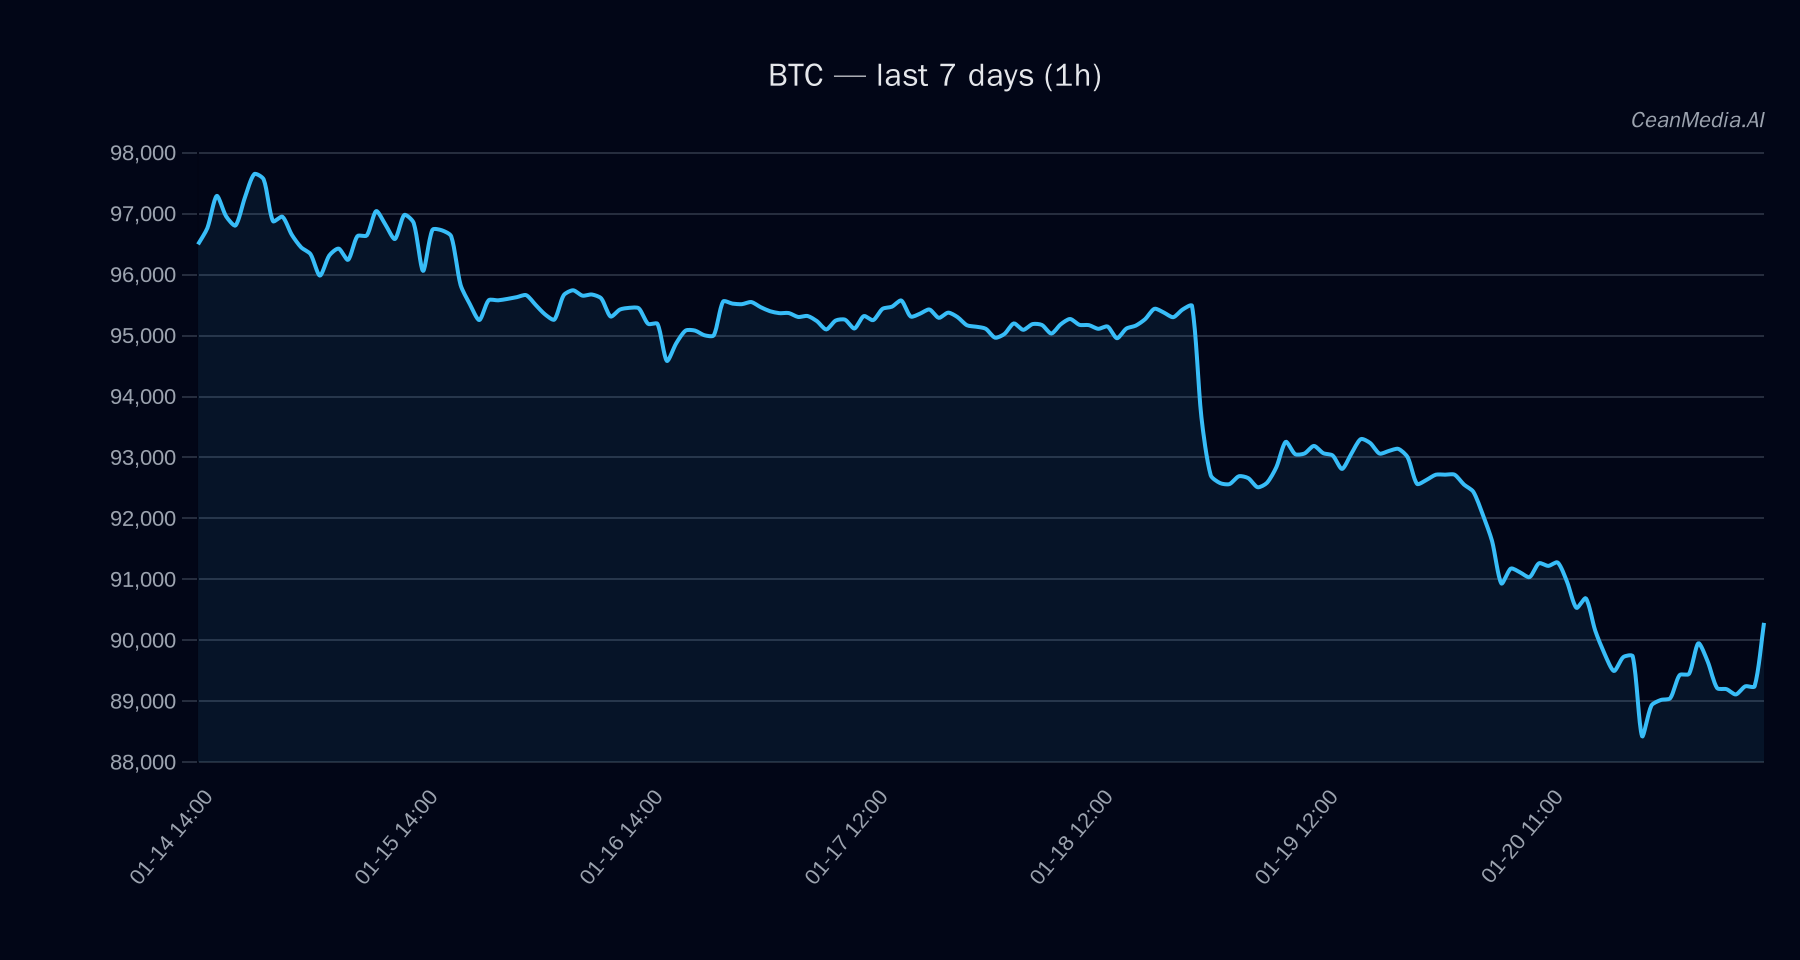
As of January 21, 2026, Bitcoin (BTC) is trading near key support and resistance levels, with a current price of approximately $88,287.37. Recent market sentiment remains cautious, with indicators showing oversold conditions and very low volatility. ETF flows for BTC and ETH continue to reflect risk-off sentiment, with notable outflows over the past week, impacting overall market dynamics.
Technical Analysis: BTC
- Levels: Major support at $86,525; near-term support at $86,525. Major resistance at $90,050; near-term resistance at $90,050. Break above $90,050 targets $91,854–$93,655, while a move below $86,525 could lead to $84,791–$83,060.
- Bias: Bearish with oversold RSI at 29, indicating potential for a short-term rebound if key resistance levels are broken. The EMA12 is below EMA26, and SMA50 below SMA200, reinforcing the bearish trend.
- Triggers & Invalidation: A close above $90,050 invalidates the bearish bias and signals potential upside. Conversely, a close below $86,525 confirms downside risk.
Drivers
- Top Factors: Slight positive EMA slope (0.0015), but overall momentum remains weak with a trend strength of 0.27.
- Volatility & Sentiment: Very low volatility regime (σ24h 0.47%), with extreme fear sentiment (F&G index 24). Return over 24h is marginally negative (-0.44%), indicating subdued trading activity.
- Market Dynamics: Funding Z-score at -0.18 and basis Z-score at -2.21 suggest limited bullish momentum. Order book imbalance remains slightly negative, reflecting cautious positioning.
ETF Flows (BTC/ETH)
Current ETF flows show significant outflows for both BTC and ETH over recent periods, with BTC ETFs down by approximately $479.7 million in one day and $1.34 billion over ten days. ETH ETF outflows are also notable, indicating a risk-off environment. While these flows are only for BTC and ETH, they provide important context regarding investor sentiment and risk appetite.
What to Watch Next
- Monitor for a decisive move above $90,050 to confirm potential upside continuation.
- Watch for a break below $86,525 to validate further downside risk and target lower support levels.
- Keep an eye on ETF flow trends for BTC and ETH as a gauge of broader market sentiment.
- Observe RSI and volatility indicators for signs of trend reversal or acceleration.
Note: ETF flow data is only available for BTC and ETH and serves as contextual information rather than a primary trading signal.
Hashtags: #Bitcoin #CryptoAnalysis #MarketUpdate #CryptoTrends #BTC #ETH #TradingStrategy #CryptoNews #FinancialAnalysis #CryptoMarkets #TechnicalAnalysis #ETFFlows