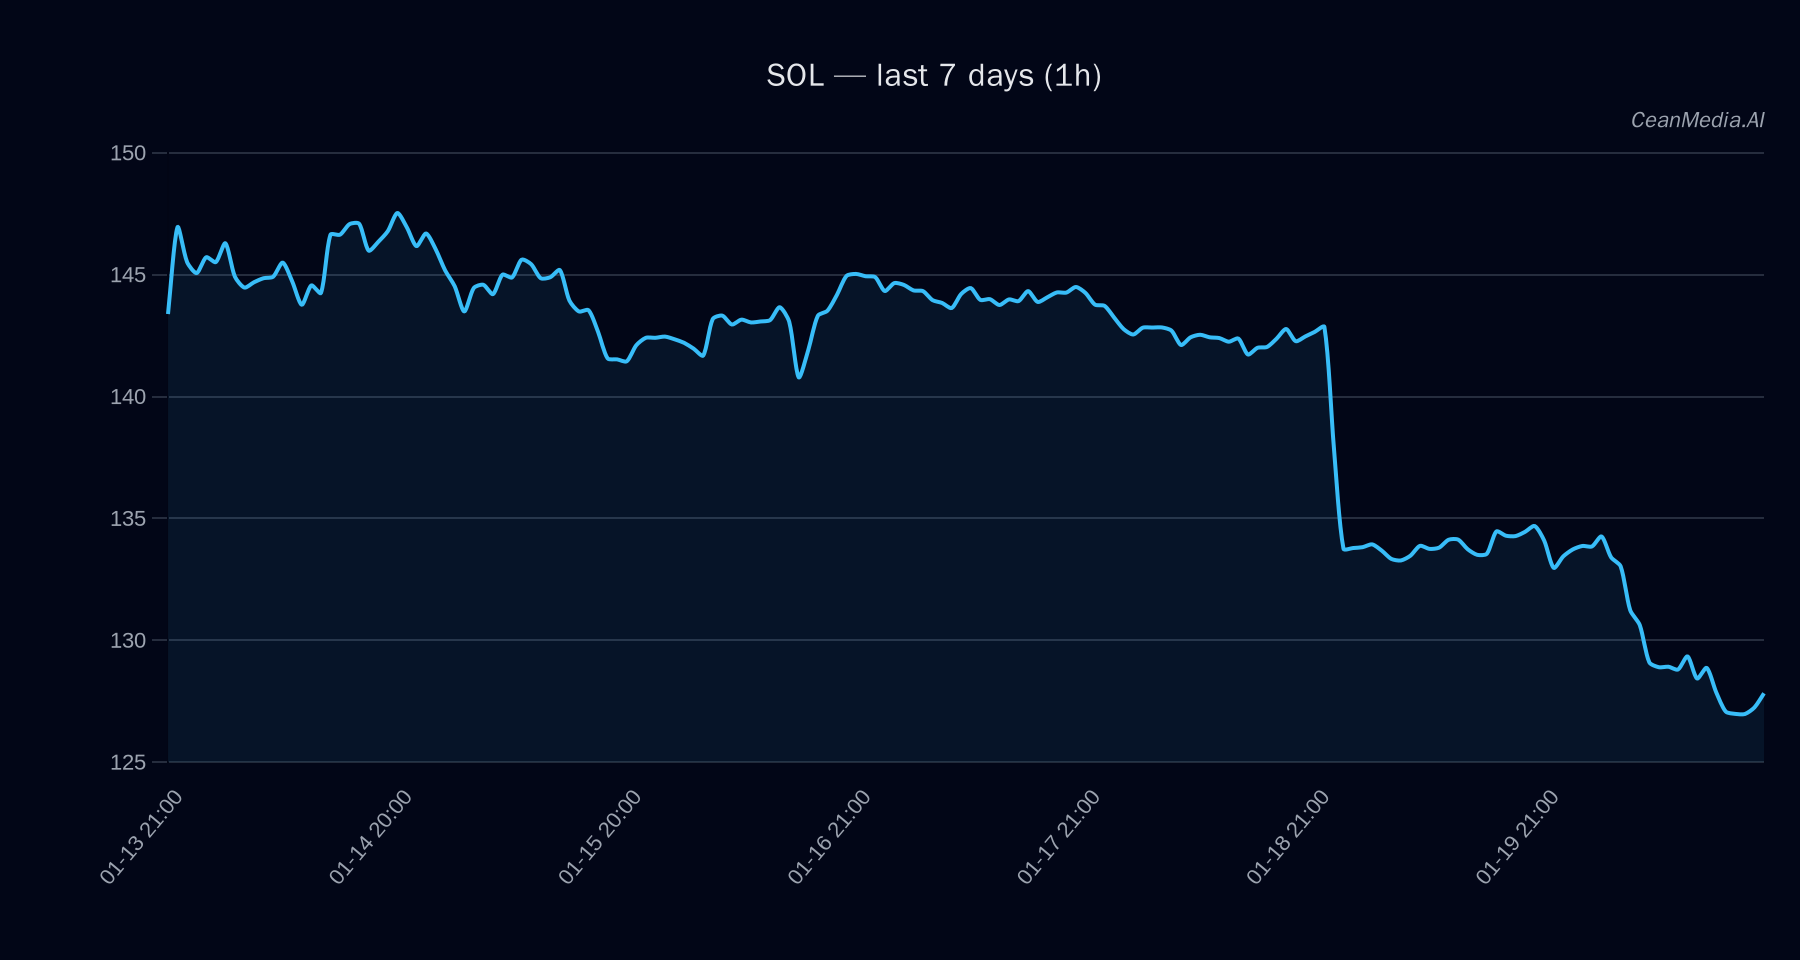
Market Snapshot
As of January 21, 2026, Solana (SOL) is trading near key support levels, with current price at approximately $126.13. The broader market exhibits low volatility, with very low trading regimes and oversold conditions indicated by RSI at 20. ETF flows show mixed signals in the crypto space, with Bitcoin experiencing outflows and Ethereum seeing inflows over recent periods, implying a nuanced risk sentiment environment.
Technical Analysis: SOL
- Levels: SOL is currently between support at around $124 and resistance at approximately $129. A break above $129 targets a move towards $131.23 to $133.80. Conversely, a decline below $124 risks a move down to $118.66.
- Bias: Bearish, confirmed by EMA12 below EMA26, SMA50 below SMA200, and RSI at an oversold level (20). The short-term forecast indicates a 48% probability of downside movement.
- Triggers: An hourly close above $129 would suggest potential upward momentum towards the resistance zone. A close below $124 signals further downside risk.
- Invalidation: A sustained move above $134 (major resistance) or below $118 (near support) would invalidate the current bearish bias and suggest a potential trend reversal.
Drivers
- Top Factors: Key drivers include a slight negative return over the past 24 hours (-0.05%), a marginally declining EMA slope (-0.0008), and negative funding and basis z-scores (-1.1 and -1.2 respectively), indicating bearish sentiment.
- Momentum & Volatility: The order-book imbalance is modest (0.06), and 7-day realized volatility remains low (0.03), supporting the low-volatility regime. Market breadth is currently weak, with breadth over 50 hours at 0%, and the Fear & Greed index at 32, indicating cautious sentiment.
ETF Flows (BTC/ETH)
Recent ETF flow data shows Bitcoin experiencing significant outflows over the last day (-$394.7M), but inflows over 5 and 10 days, suggesting short-term risk-off sentiment. Ethereum, however, has seen consistent inflows (+$4.7M daily, +$190.2M over 5 days, +$120M over 10 days), indicating a relative risk-on approach among ETH investors. It is important to note that these flows are only for BTC and ETH and serve as macro context rather than direct signals for SOL.
What to Watch Next
- Monitor for a decisive break above $129 to confirm potential upward movement towards $133.80.
- Watch for a close below $124, which could accelerate downside momentum towards $118.
- Keep an eye on broader market sentiment, especially ETH inflows, as a risk-on indicator.
- Observe ETF flows in BTC and ETH for macro risk appetite cues, understanding they are only context for SOL’s market environment.
Hashtags: #Solana #CryptoAnalysis #MarketUpdate #TechnicalAnalysis #ETFFlows #Bitcoin #Ethereum #CryptoSentiment #Altcoins #TradingStrategy #MarketTrends #CryptoRisk