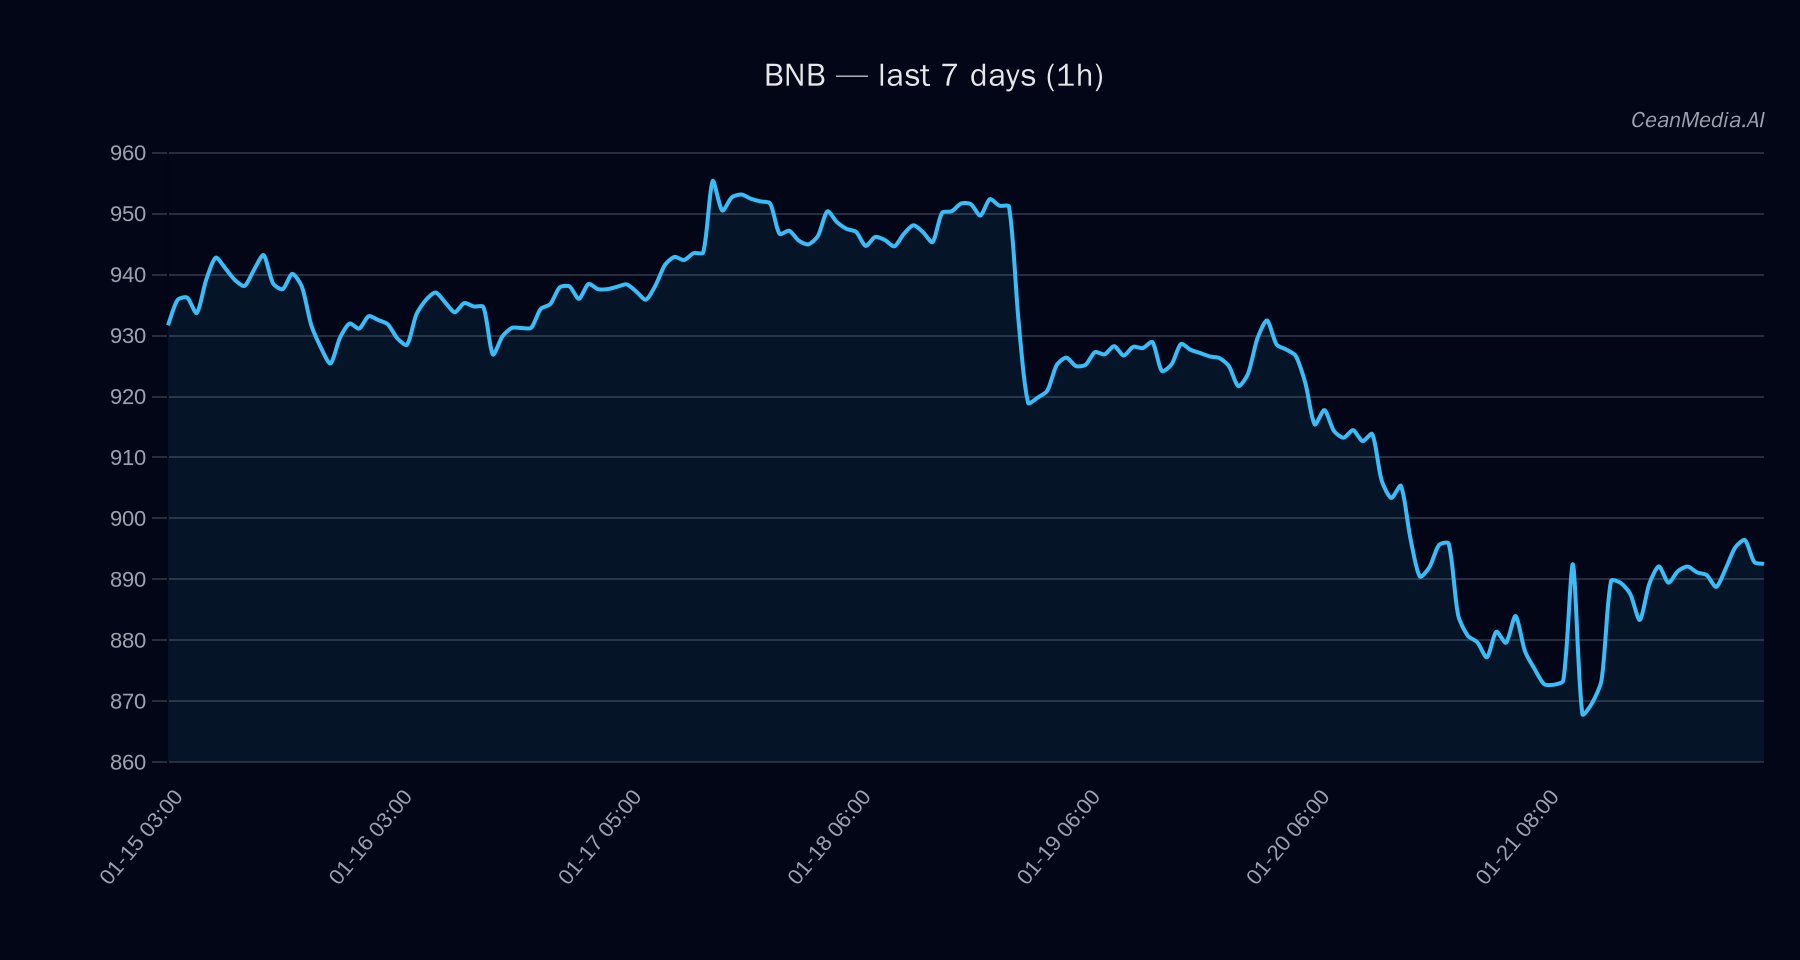
Market Snapshot
As of January 22, 2026, BNB is trading around $887.33, with a short-term forecast indicating a 54% probability of upward movement. The broader market exhibits very low volatility, and the asset remains within a consolidation zone between key support at $870 and resistance at $905.
Technical Analysis: BNB
- Levels: Support at $870 (major), near-term support at $890; Resistance at $905 (near), major resistance at $930.
- Bias: Sideways with a slight upward tilt; EMA12 > EMA26, SMA50 < SMA200, RSI at 47 indicating neutral momentum.
- Triggers: A close above $905 could push the price toward $923–$941; a close below $870 may see a decline toward $834–$852.
- Invalidation: Break below $870 invalidates short-term bullish outlook, while a move above $905 confirms potential upside.
Drivers
- EMA slope remains positive at 0.0002, indicating mild upward momentum.
- Funding Z-Score (-0.32) and Basis Z-Score (-0.34) suggest neutral funding conditions.
- Order-book imbalance (EMA5) at -0.18 points to slight selling pressure.
- Market volatility remains very low, with a 24-hour sigma of 0.87%.
- Market breadth exceeds 50%, with only 33% participation, indicating cautious sentiment.
- Correlation with BTC over 72 hours is weak at -0.23, emphasizing independent dynamics.
ETF Flows (BTC/ETH)
Recent ETF flow data shows significant outflows from Bitcoin and Ethereum ETFs, with BTC ETF down by approximately $352 million over one day and ETH ETF down by about $36.7 million. Over five and ten days, cumulative outflows exceed $1 billion for BTC and over $400 million for ETH. These flows suggest a risk-off sentiment prevailing in the broader crypto markets, although they are only indirect context for BNB’s outlook.
What to Watch Next
- Monitor the price action around the $905 resistance for potential breakout confirmation.
- Watch for a decline below $870 to assess downside risks and invalidation of the current sideways bias.
- Keep an eye on overall market volatility and ETF flows as indicators of risk sentiment.
- Observe broader market breadth and correlation trends for additional context.
Note: ETF data pertains only to BTC and ETH and serves as market sentiment context rather than a direct signal for BNB.
Hashtags: #Crypto #Binance #BNB #TechnicalAnalysis #MarketAnalysis #CryptoMarket #ETFFlows #RiskOnOff #Altcoins #CryptoTrading #MarketStrategy #Investing