Market Snapshot
As of January 22, 2026, LINK is trading around $12.53, with a sideways bias in the near term. The broader crypto market is experiencing low volatility and a cautious sentiment, as reflected by recent ETF outflows in Bitcoin and Ethereum, indicating risk-off sentiment among investors.
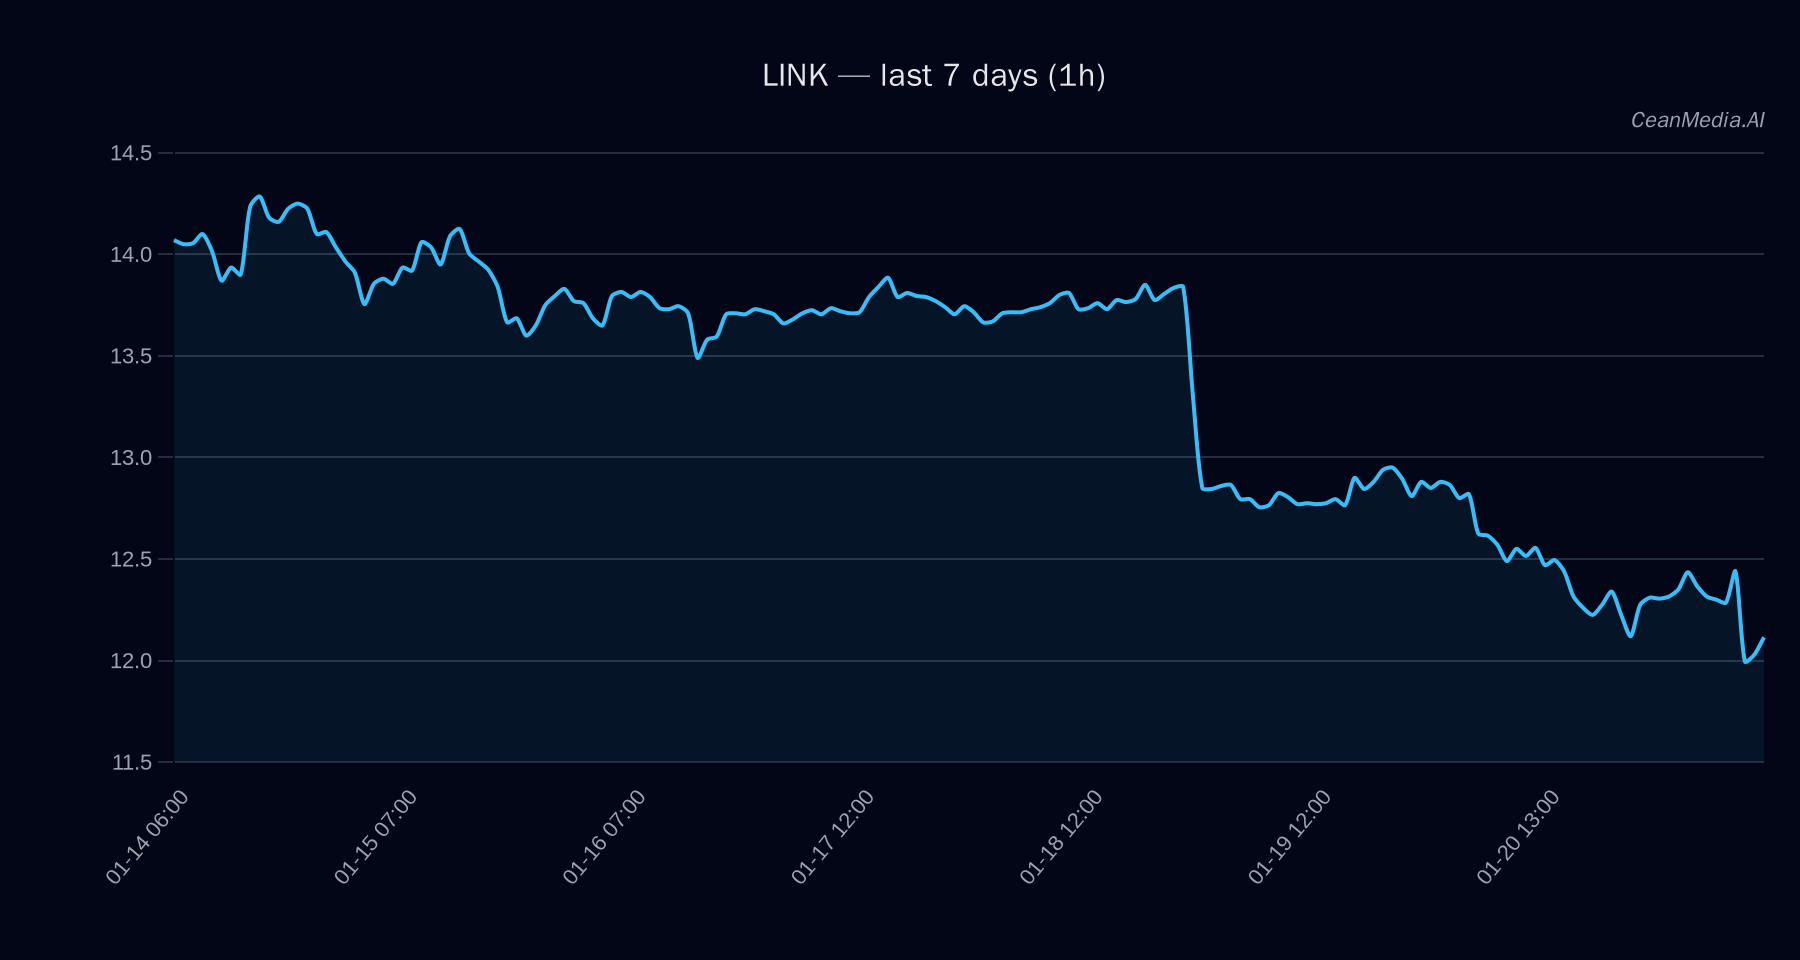
Technical Analysis: LINK
LINK is currently positioned between key support at approximately $12.3 and resistance near $12.8. A break above $12.8 could open the path toward $13.04–$13.29, while a decline below $12.3 may lead toward $11.79–$12.03. The technical indicators show a neutral bias:
- EMA12 is below EMA26, indicating short-term downward momentum.
- SMA50 remains below SMA200, confirming a longer-term sideways trend.
- RSI stands at 55, suggesting neither overbought nor oversold conditions.
- Volatility remains low, supporting a sideways trading environment.
Drivers
The primary factors influencing LINK include:
- 24-hour return at approximately -0.9%, indicating mild negative momentum.
- EMA slope slightly negative, reflecting a gentle downward trend.
- Funding and basis Z-scores remain near neutral, suggesting no extreme funding pressure.
- Order book imbalance favors stability but does not signal a decisive move.
- Bitcoin’s 24-hour return at -1% and its low trend strength underscore cautious market sentiment.
Volatility and trend strength indicators point to a low-volatility environment with no immediate breakout signals.
ETF Flows (BTC/ETH)
Recent ETF data shows significant outflows: Bitcoin ETFs have experienced a 1-day outflow of approximately $479.7 million, with cumulative outflows over 5 and 10 days reaching $81.4 million and $1.34 billion respectively. Ethereum ETFs have faced similar declines, with a 1-day outflow of $230 million and a 10-day total of $278 million. While these flows reflect heightened risk-off sentiment in BTC and ETH, they are only context for LINK and should not be considered primary signals for its price action.
What to Watch Next
- Monitor LINK’s price action around the $12.8 resistance for potential breakout confirmation.
- Watch for a decline below $12.3 that could signal further downside toward $11.79–$12.03.
- Keep an eye on broader market sentiment, especially ETF flows, which indicate risk appetite shifts.
- Observe technical indicators for any signs of trend reversal or acceleration.
Hashtags: #CryptoAnalysis #LINK #MarketUpdate #TechnicalAnalysis #ETFFlows #Bitcoin #Ethereum #CryptoNews #TradingSignals #CryptoMarket #RiskOff #Investing