Market Snapshot
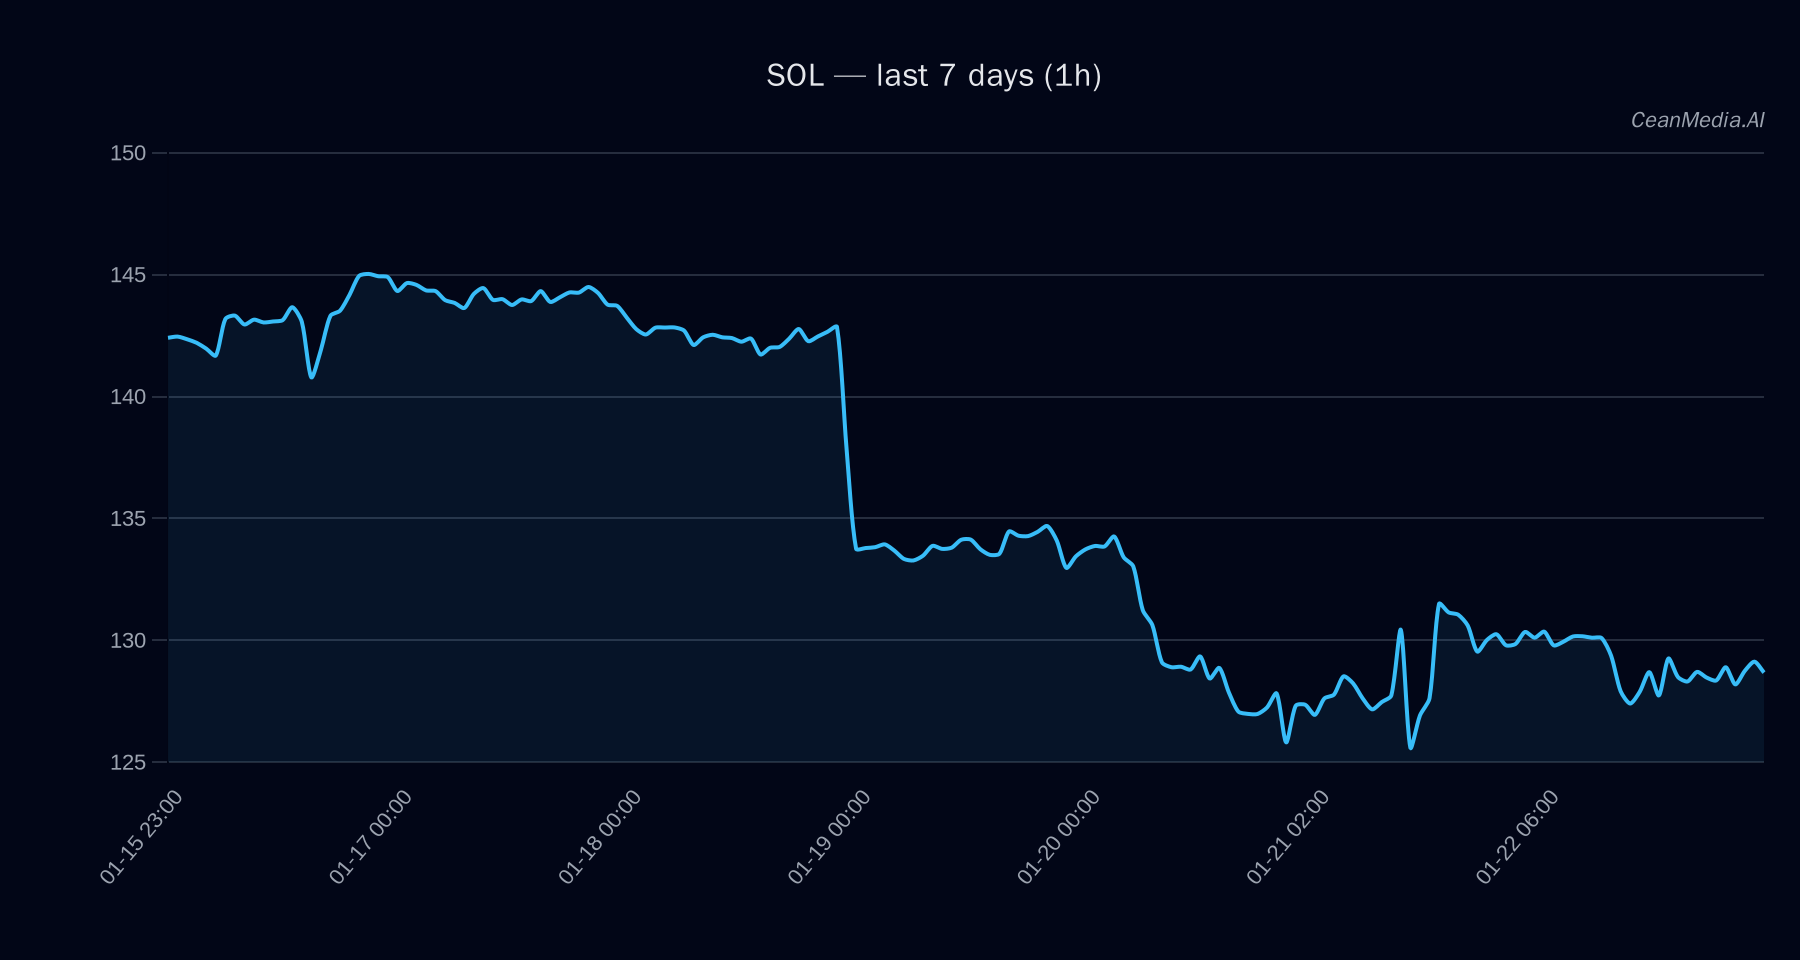
On January 23, 2026, Solana (SOL) trades around 127.68, with a short-term forecast indicating a 61% probability of upward movement. Market conditions are characterized by very low volatility and neutral momentum signals, with the asset sitting between key support at 125 and resistance at 130. Broader market sentiment shows extreme fear, and Bitcoin dominance remains near 57.5%, slightly increasing over the past week.
Technical Analysis: SOL
- Levels: Support at 125 (major), 130 (near resistance); Resistance targets at 137 (major), with an upside potential to 132.84–135.44 if break above 130.
- Bias: Bearish overall, as EMA12 is below EMA26 and SMA50 is below SMA200. RSI stands at 43, indicating neutral momentum.
- Triggers: A daily close above 130 could accelerate gains towards 132.84–135.44; a close below 125 could lead to declines towards 122.62–120.12.
- Invalidation: A close above 137 would signal a stronger bullish reversal, while a close below 120 would reinforce bearish pressure.
Drivers
- Top factors influencing SOL include a slight negative return over the past 24 hours (-1%), a flat EMA slope, and a funding Z-score of -0.85 indicating slightly bearish funding conditions.
- Order book imbalance remains slightly bullish at 0.08, but overall momentum is subdued, supported by a low volatility regime.
- Bitcoin’s 24-hour return is marginally negative (-0.46%), with a trend strength around 0.3, reflecting limited directional momentum in the broader crypto market.
- Market sentiment is cautious, with extreme fear indicated by Fear & Greed index at 24.
ETF Flows (BTC/ETH)
Current ETF flows show significant outflows from Bitcoin ETFs, with a daily decline of approximately $9.8 million and a 5-day total outflow of over $1.26 billion. Conversely, Ethereum ETFs have experienced modest inflows, totaling around $2.4 million today, but with a 5-day outflow of approximately $244 million. These flows suggest a risk-off environment, primarily driven by Bitcoin outflows, while ETH shows some resilience, though overall market sentiment remains cautious. It is important to note that ETF flows are only available for BTC and ETH and should be considered as supplementary context rather than primary signals for SOL.
What to Watch Next
- Monitor if SOL breaks above 130 to target 132.84–135.44, confirming bullish momentum.
- Watch for a close below 125, which could prompt further declines towards 122.62–120.12.
- Keep an eye on Bitcoin ETF outflows, as they may influence overall risk appetite.
- Observe broader market sentiment and volatility regimes for potential shifts in momentum.
Hashtags: #Solana #CryptoAnalysis #MarketUpdate #TechnicalAnalysis #ETFFlows #Bitcoin #Ethereum #CryptoTrends #TradingSignals #MarketSentiment #CryptoForecast