Market Snapshot
As of January 24, 2026, BNB is trading around $888.76 with a short-term upward bias probability of approximately 51%. The broader market sentiment remains cautious, with volatility at very low levels and a Fear metric indicating Extreme Fear conditions. Bitcoin and Ethereum ETF flows suggest a mixed risk appetite, with ETH inflows indicating some risk-on sentiment, while BTC continues to see outflows, highlighting ongoing market uncertainty.
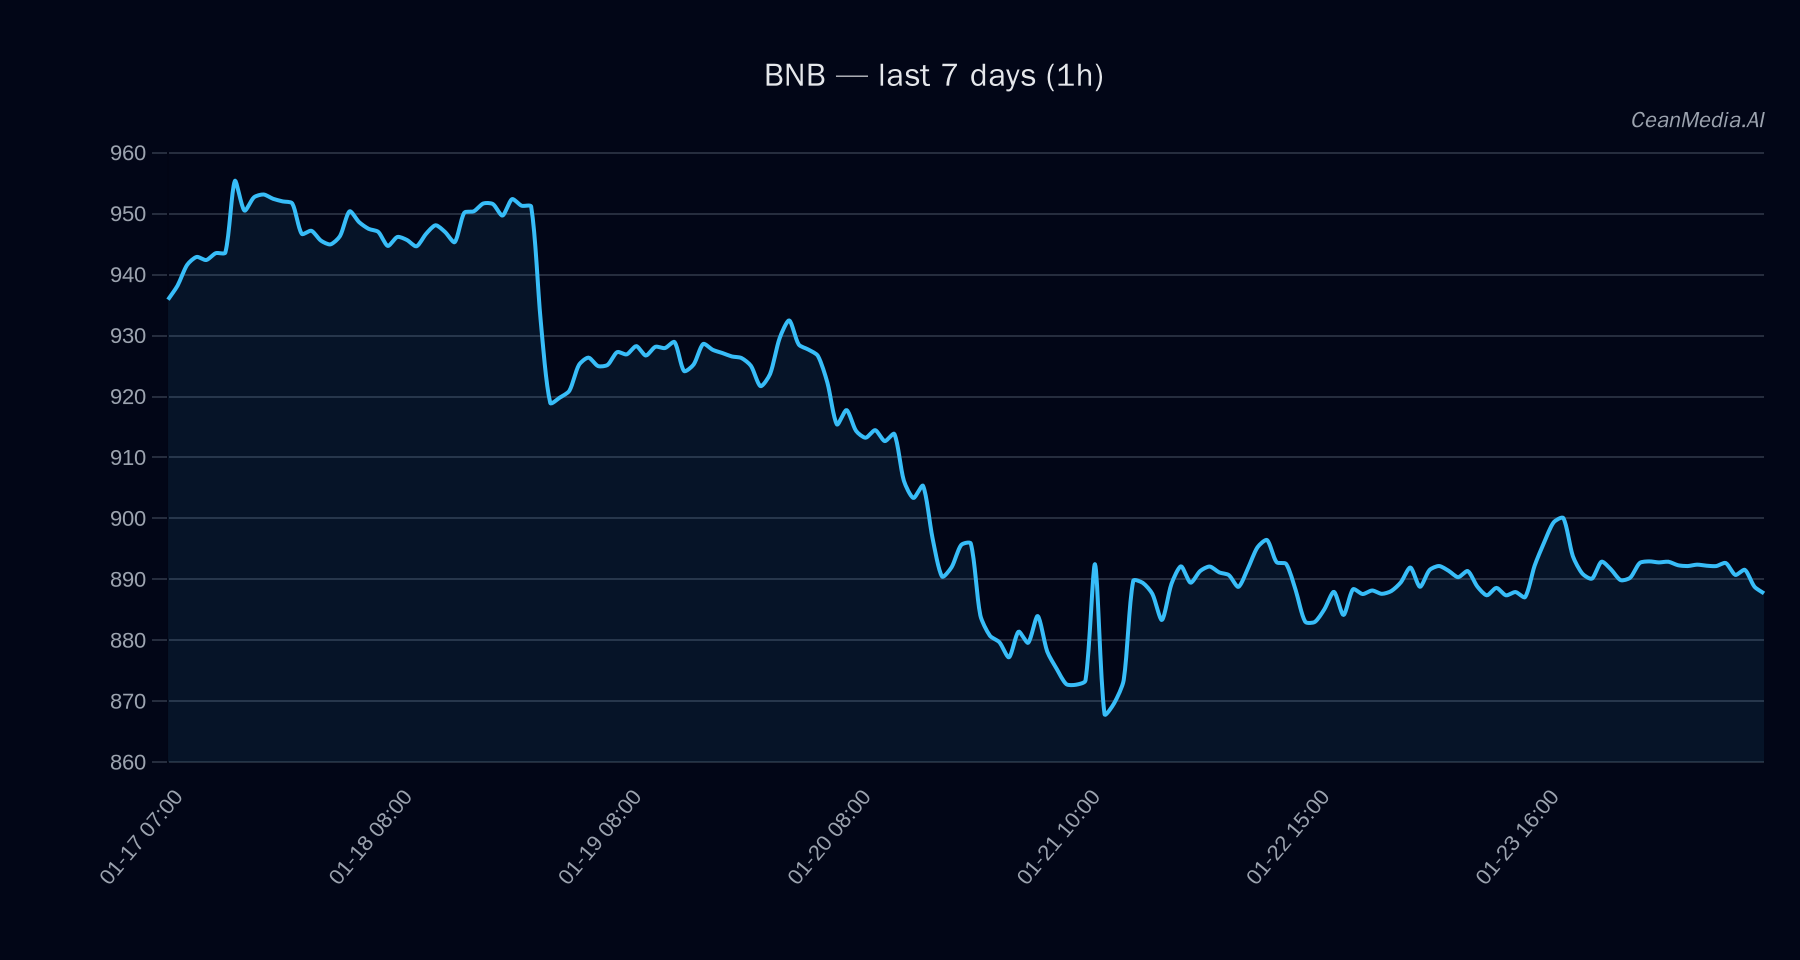
Technical Analysis: BNB
BNB is currently trading between a support level near $871 and a resistance level around $907. A breakout above $907 could propel the price toward the $924.67 to $942.80 range, while a decline below $871 could see a move down to approximately $853.57 to $836.15. The technical indicators show a bearish trend, with EMA12 below EMA26, SMA50 below SMA200, and RSI at 42, reflecting neutral momentum but with downward pressure. The probability of an upward move remains slightly over 50%, but the overall bias is bearish, requiring a close above $907 to confirm a bullish breakout. Invalidation occurs if the price closes below support at $871.
Drivers
- Return over the past 24 hours is slightly negative at -0.39%.
- EMA slope remains negative at -0.0005, indicating ongoing short-term bearish momentum.
- Funding and basis Z-scores are negative, suggesting slight bearish funding conditions.
- Order-book imbalance remains neutral with a small positive value, indicating limited buying pressure.
- Bitcoin’s 24-hour return is also negative at -0.53%, and its trend strength is moderate at 0.44, reflecting cautious market sentiment.
- Market volatility remains very low, and the overall breadth is weak at 17%, indicating limited participation.
- Market sentiment is in Extreme Fear, with the Fear & Greed index at 25.
ETF Flows (BTC/ETH)
Recent ETF flow data shows a notable divergence: Bitcoin ETFs have experienced significant outflows over the past 5 and 10 days, totaling approximately $1.24 billion and $578.5 million respectively, suggesting risk-off sentiment. Conversely, Ethereum ETFs have seen inflows of $2.8 million over one day, with smaller outflows over 5 and 10 days, indicating a relatively more risk-on attitude towards ETH. These flows provide context but are not primary signals for BNB’s immediate direction.
What to Watch Next
- Monitor price action around key support at $871 and resistance at $907 for potential breakouts.
- Watch for a daily close above $907 to confirm bullish momentum targeting $924.67–$942.80.
- Keep an eye on overall market sentiment, especially Bitcoin and Ethereum ETF flows, for broader risk appetite signals.
- Observe changes in volatility and breadth indicators for early signs of trend shifts.
Hashtags: #BNB #CryptoAnalysis #MarketUpdate #TechnicalAnalysis #ETFFlows #Bitcoin #Ethereum #Altcoins #CryptoTrends #MarketSentiment #CryptoNews