Market Snapshot
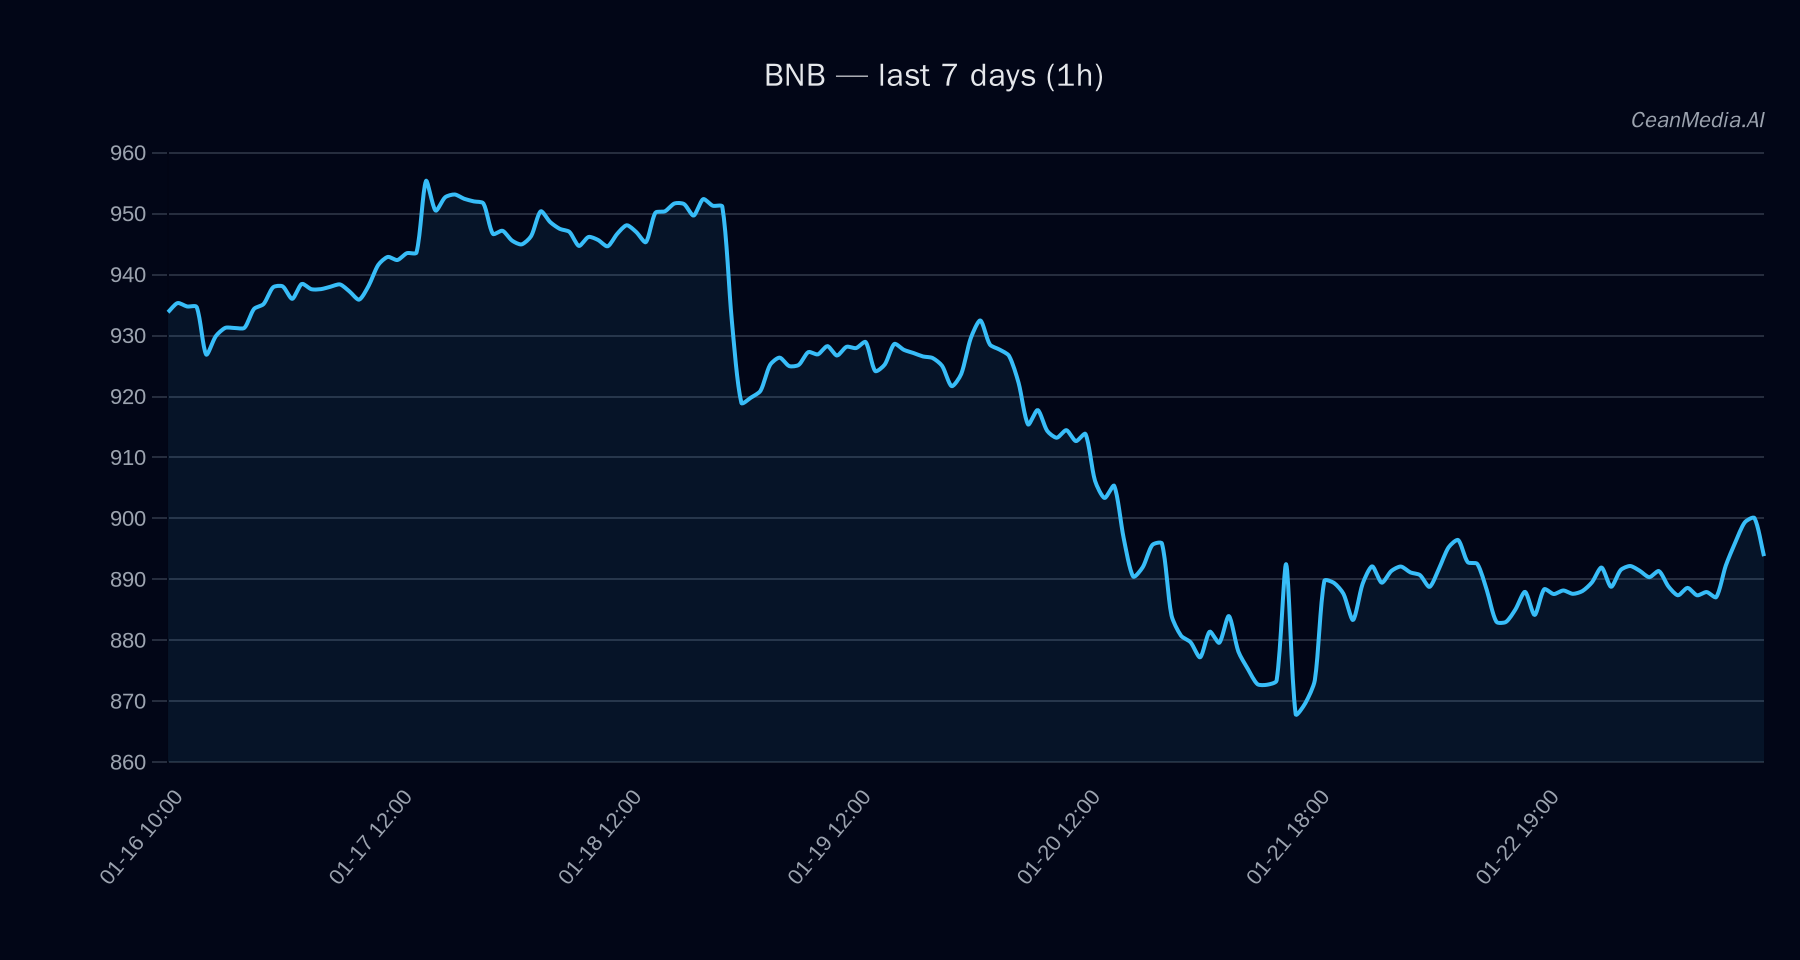
As of January 24, 2026, BNB is trading near 891.77 USD with a slight upward bias in the short term. Market conditions reflect very low volatility and a neutral RSI, indicating a sideways trend. Broader market sentiment remains cautious with fear prevalent in the crypto space, while Bitcoin and Ethereum exhibit mixed ETF flows that influence overall risk appetite.
Technical Analysis: BNB
BNB currently sits between key support at approximately 874 USD and resistance at 910 USD. A break above 910 USD could target levels near 927.80 to 945.99 USD, signaling potential upward momentum. Conversely, a decline below 874 USD may lead to retesting lower support zones around 856.46 to 839.00 USD. Technical indicators show EMA12 above EMA26, with SMA50 below SMA200, and RSI at a neutral 51, suggesting a sideways bias. The probability of an upward move within the next 24 hours stands at approximately 51%, with a slightly higher chance of sideways movement.
Drivers
- Return 24H: +0.02%
- EMA Slope: +0.0015, indicating mild positive momentum
- Funding Z-Score: 0.45
- Basis Z-Score: 0.69
- Order Book Imbalance (EMA5): -0.08, suggesting slight demand imbalance
- BTC Return 24H: +0.01%
- BTC Trend Strength: 0.82, indicating moderate bullishness
The overall drivers point to a cautious but slightly positive short-term outlook, with momentum indicators remaining subdued amid low volatility and neutral market sentiment.
ETF Flows (BTC/ETH)
Recent ETF flow data shows a significant outflow from Bitcoin ETFs, totaling approximately -$9.8 million daily and cumulative losses over the past 10 days of nearly $1 billion. Conversely, Ethereum ETFs have experienced inflows of about +$2.4 million daily, with smaller net outflows over the same period. This pattern suggests a risk-off environment for Bitcoin, while Ethereum maintains some investor interest. It is important to note that these flows are only for BTC and ETH and serve as broader market context rather than direct signals for BNB.
What to Watch Next
- Monitor if BNB breaks above the 910 USD resistance for confirmation of a short-term bullish move.
- Watch for a decline below 874 USD to assess potential downside risks.
- Observe broader crypto ETF flows, especially Bitcoin outflows, for signs of changing risk sentiment.
- Keep an eye on Bitcoin and Ethereum market trends as they influence overall crypto market dynamics.
Hashtags: #CryptoAnalysis #BNB #MarketUpdate #TechnicalAnalysis #ETFFlows #CryptoTrends #Bitcoin #Ethereum #Altcoins #RiskOn #RiskOff