Market Snapshot
As of January 24, 2026, Solana (SOL) is trading around $127.52, with a short-term forecast indicating a 66% probability of upward movement. The broader market sentiment shows low volatility and a cautious stance, with the Fear & Greed Index at Extreme Fear levels. Bitcoin and Ethereum ETF flows provide additional context for market risk appetite, though they are not primary signals for SOL.
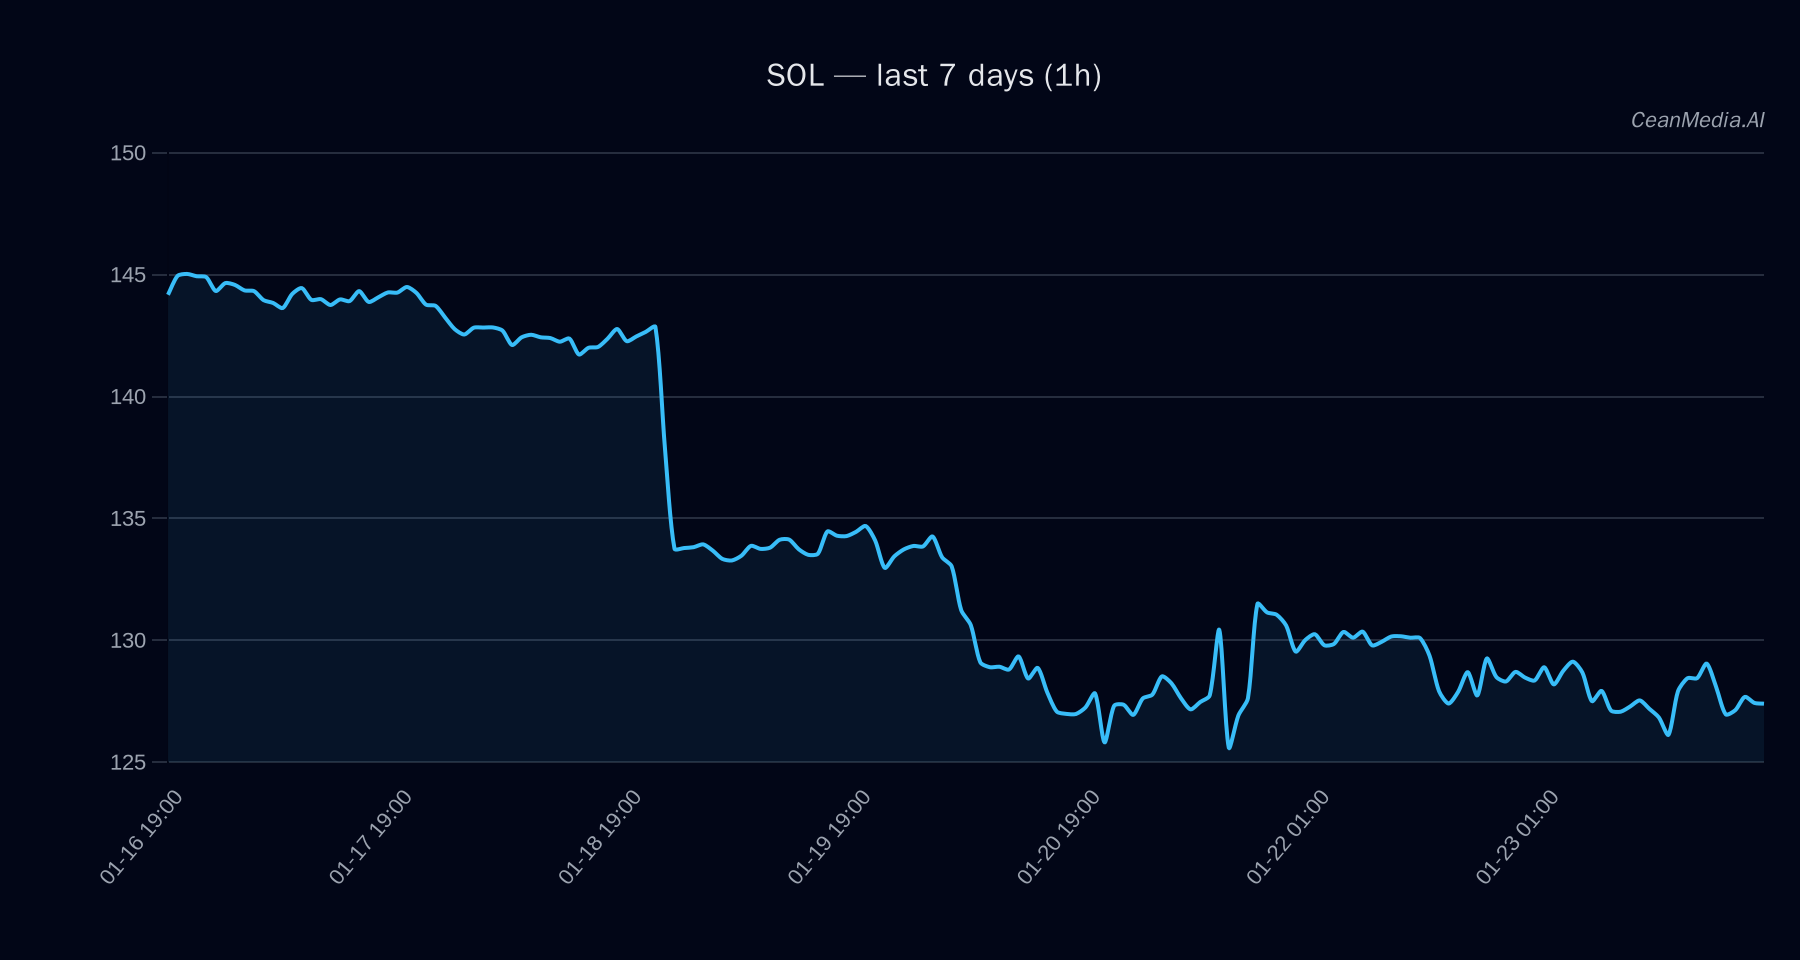
Technical Analysis: SOL
Current technical indicators place SOL in a neutral to mildly bearish zone. The price sits between key support at $125 and resistance at $130. A breakout above $130 could target $132.67 to $135.27, while a decline below $125 would likely see the price test $122.47 to $120.00.
- Levels: Support at $125 (near), Major support at $128; Resistance at $130 (near), Major resistance at $136.
- Bias: Slightly bearish with EMA12 below EMA26 and SMA50 below SMA200. RSI remains neutral at 47, indicating balanced momentum.
- Triggers: Break above $130 signals potential upside, while a drop below $125 suggests downside risk.
- Invalidation: Price falling below $125 would invalidate near-term bullish prospects.
Drivers
The top drivers influencing SOL include minor negative returns over the past 24 hours (-0.0074) and a slight downward slope in the EMA trend. Market sentiment remains cautious, with funding and basis Z-Scores indicating a slightly bearish funding environment. Bitcoin’s 24-hour return is marginally negative, reinforcing the risk-off tone, while overall volatility is very low, suggesting subdued market activity.
ETF Flows (BTC/ETH)
Current ETF flows show a significant outflow from Bitcoin ETFs, with a 1-day decline of $9.8 million and a 5-day total of -$1.26 billion, indicating a risk-off environment. Conversely, Ethereum ETFs have experienced inflows, with a 1-day increase of $2.4 million, suggesting a modest risk-on tilt within the altcoin space. While these flows are only relevant for BTC and ETH, they provide useful context for overall market sentiment and risk appetite.
What to Watch Next
- Monitor the price action around the $125 support level for signs of further downside or reversal.
- Watch for a break above $130 to confirm bullish momentum towards $132.67–$135.27.
- Keep an eye on Bitcoin ETF outflows, which may signal continued risk-off sentiment.
- Observe broader market volatility and the Fear & Greed Index for shifts in investor sentiment.
Note: ETF flows are only available for BTC and ETH and serve as context rather than a primary signal for SOL.
Hashtags: #Solana #CryptoAnalysis #MarketUpdate #Bitcoin #Ethereum #ETFFlows #TechnicalAnalysis #CryptoTrends #MarketSentiment #Altcoins #CryptoNews #Investing