Market Snapshot
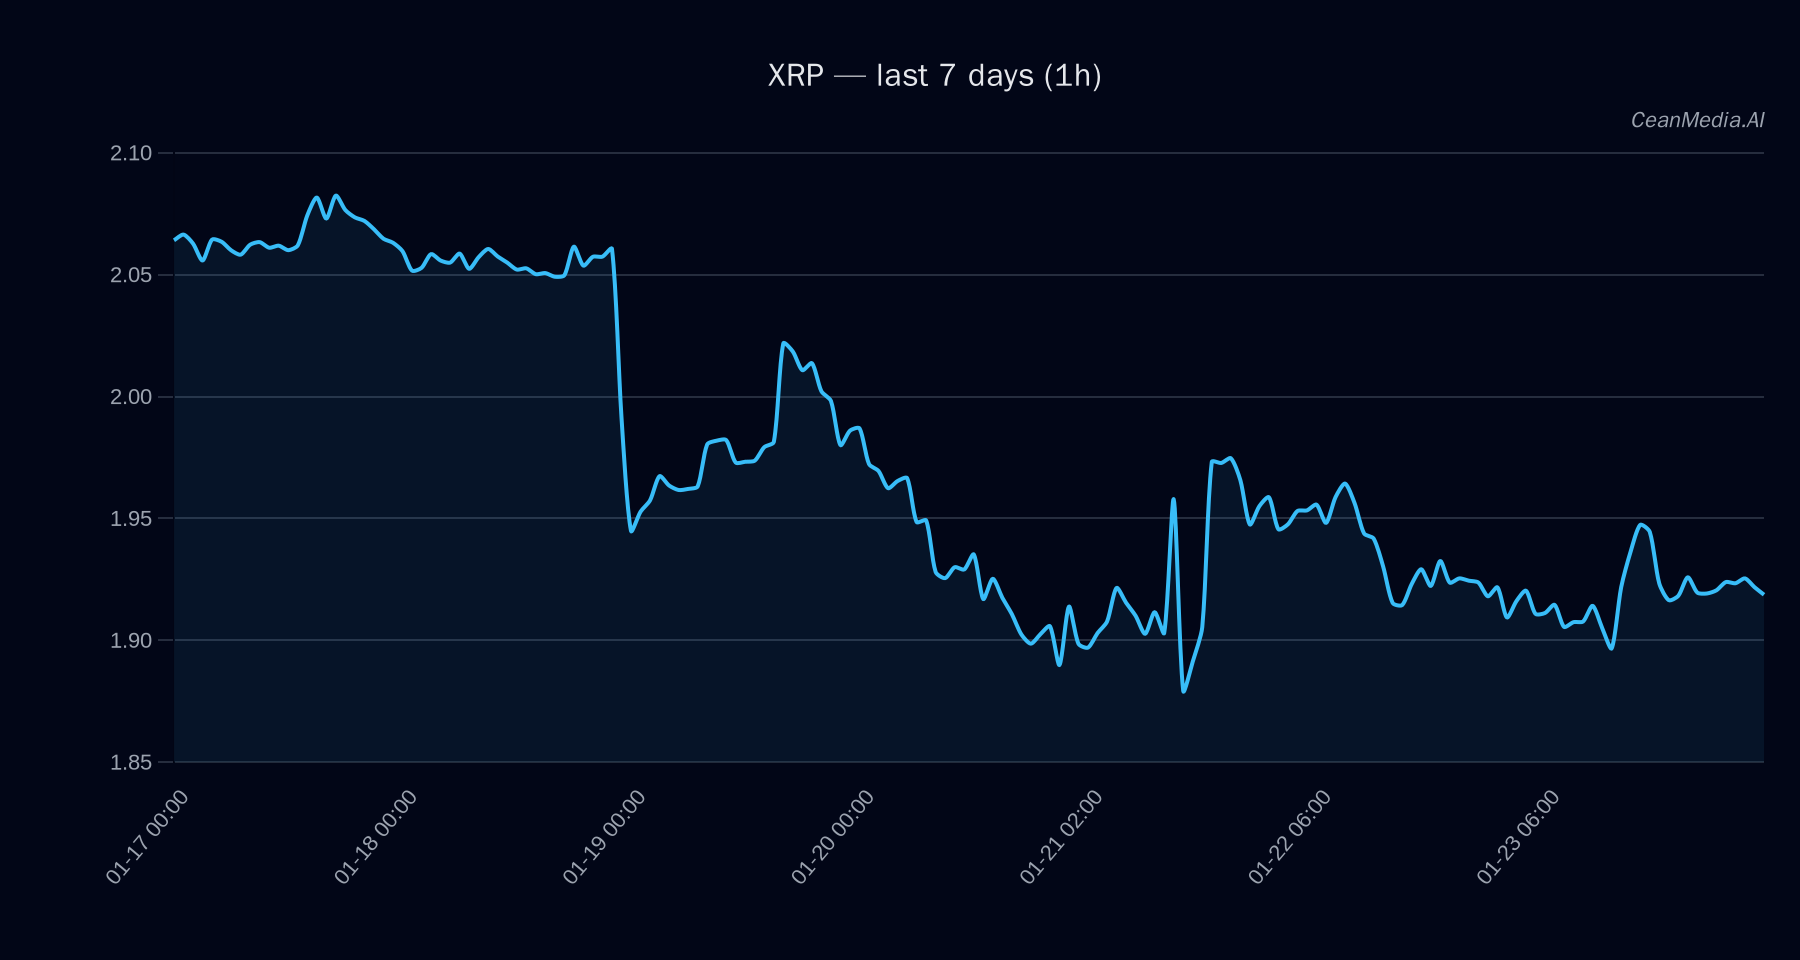
As of January 24, 2026, XRP is trading around $1.92, with a short-term forecast indicating a slight upward bias. Market sentiment remains cautious, with volatility regime at very low levels and neutral RSI readings. Broader ETF flows show a divergence between Bitcoin and Ethereum, providing additional context for risk appetite in the crypto space.
Technical Analysis: XRP
- Levels: Support is identified near $1.88, with major resistance at approximately $1.96. A breakout above $1.96 could push XRP towards $1.9984–$2.0376, while a breakdown below $1.88 may lead to declines towards $1.8447–$1.8071.
- Bias: Bearish overall, as indicated by EMA12 below EMA26, SMA50 below SMA200, and RSI at 49.
- Triggers: A close above $1.96 signals potential for upward momentum; a close below $1.88 indicates downside risk.
- Invalidation: Break below $1.88 invalidates short-term bullish scenarios; break above $1.96 invalidates bearish bias.
Drivers
- The top drivers include a modest 24-hour return of 0.39%, a slight negative EMA slope, and moderate funding and basis Z-scores (0.45 and 0.94 respectively), indicating limited momentum and neutral volatility.
- Order-book imbalance remains positive but modest, while Bitcoin’s 24-hour return (0.15%) and trend strength are minimal, suggesting subdued cross-asset influence.
- Market breadth exceeds 50%, but overall volatility remains very low, and the Fear & Greed index indicates extreme fear, which could suppress immediate price moves.
ETF Flows (BTC/ETH)
Current ETF data shows a significant outflow from Bitcoin ETFs, with a 1-day decline of $1.9 million and larger outflows over 5 and 10 days. Conversely, Ethereum ETFs are experiencing inflows, with a 1-day increase of $2.8 million. This divergence suggests a shift in risk appetite, with some investors rotating into ETH and away from BTC, potentially impacting overall market sentiment. It is important to note that ETF flows pertain only to BTC and ETH and should be considered as contextual rather than primary signals for XRP.
What to Watch Next
- Monitor XRP’s price action relative to the key support at $1.88 and resistance at $1.96.
- Watch for a decisive close above or below these levels to confirm short-term trend direction.
- Keep an eye on broader crypto market sentiment, especially changes in ETF flows and macro risk appetite.
- Observe any shifts in technical momentum indicators, such as RSI and moving averages, for early signals.
Hashtags: #XRP #CryptoAnalysis #Bitcoin #Ethereum #MarketUpdate #TechnicalAnalysis #ETFFlows #CryptoTrends #RiskOn #RiskOff #CryptoNews #MarketInsights